Nfil3/E4bp4 is required for the development and maturation of NK cells in vivo - PubMed (original) (raw)
. 2009 Dec 21;206(13):2977-86.
doi: 10.1084/jem.20092176. Epub 2009 Dec 7.
Gordon S Duncan, Markus G Seidel, Akira Morimoto, Koichi Hamada, Gerard Grosveld, Koichi Akashi, Evan F Lind, Jillian P Haight, Pamela S Ohashi, A Thomas Look, Tak W Mak
Affiliations
- PMID: 19995955
- PMCID: PMC2806474
- DOI: 10.1084/jem.20092176
Nfil3/E4bp4 is required for the development and maturation of NK cells in vivo
Shintaro Kamizono et al. J Exp Med. 2009.
Abstract
Nuclear factor interleukin-3 (Nfil3; also known as E4-binding protein 4) is a basic region leucine zipper transcription factor that has antiapoptotic activity in vitro under conditions of growth factor withdrawal. To study the role of Nfil3 in vivo, we generated gene-targeted Nfil3-deficient (Nfil3(-/-)) mice. Nfil3(-/-) mice were born at normal Mendelian frequency and were grossly normal and fertile. Although numbers of T cells, B cells, and natural killer (NK) T cells were normal in Nfil3(-/-) mice, a specific disruption in NK cell development resulted in severely reduced numbers of mature NK cells in the periphery. This defect was NK cell intrinsic in nature, leading to a failure to reject MHC class I-deficient cells in vivo and reductions in both interferon gamma production and cytolytic activity in vitro. Our results confirm the specific and essential requirement of Nfil3 for the development of cells of the NK lineage.
Figures
Figure 1.
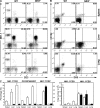
_Nfil3_−/− mice exhibit defective NK cell populations. (A and B) Representative flow cytometric histograms of NK (A, NK1.1+CD3−; B, CD122+DX5+) and NK T (NK1.1+CD3+) cells present in the indicated organs from WT and _Nfil3_−/− mice. Percentages of cells in each quadrant are representative of three mice analyzed per genotype. (C) Quantification of the percentages (left) and total numbers (right) of lymphocyte-gated NK and NK T cells in the indicated organs from WT and _Nfil3_−/− mice. Data shown are the mean ± SEM of three animals analyzed per genotype. NK cell percentages and numbers were significantly reduced in Nfil3−/− mice. *, P < 0.05; **, P < 0.01. Gating was identical to the FACS profiles shown in A and B.
Figure 2.
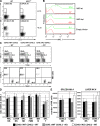
The defect in NK cell development in Nfil3−/− mice is NK cell intrinsic. (A) Impaired IL-15–induced in vitro generation of NK cells. Lin− BM cells from WT or _Nfil3_−/− mice were cultured in medium containing mSlf, mFlt3L, and mIL-7, with or without mIL-15. NK cell expansion was assessed by flow cytometry. Results shown are representative of two independent experiments. (B) Rescue by WT Nfil3. Using GFP as a marker for transfected gene expression, NK1.1 expression was determined on gated CD3−GFP+ (green) or CD3−GFP− (red) Nfil3−/− fetal liver cells (105) that had been retrovirally transduced with either the WT Nfil3 gene (wt) or a gene encoding the WT Nfil3 gene lacking its DNA binding domain (deleted [del]). Transduced cells were cultured with mIL-15. Numbers indicate the percentage of NK1.1+ cells generated. (C–E) The developmental defect in Nfil3−/− mice is NK cell intrinsic. (C) Donor-derived liver NK cell populations after BMT showing overall percentages of NK cells (top) and the percentage of CD45.1 and CD45.2 NK cells (bottom). Data shown are representative of three mice per group. (D) The ratio of CD45.2/CD45.1 cells in the various indicated lymphoid cell populations after BMT. (E) The absolute numbers of CD45.2 and CD45.1 NK cells present in spleen and liver, as calculated from the total cellularity of the lymphoid organs and the percentages of CD45.2 or CD45.1 NK1.1+CD3− cells as determined by flow cytometry. Results shown are the mean ± SD for three mice per group.
Figure 3.
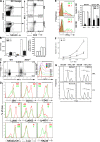
Impaired development, maturation, and function of _Nfil3_−/− NK cells. (A) The percentages of cells at each NK developmental stage in WT and Nfil3−/− BM were determined by flow cytometry. NK lineage cells were gated on BM precursors expressing equivalent levels of CD122. Figures in quadrants indicate mean percentage ± SD for three mice per group, and dot plots are representative of multiple experiments. (B, Left) Absolute numbers of cells at each NK developmental stage in BM (mean ± SD, n = 3 mice/group). Absolute numbers of NK populations were significantly reduced in Nfil3−/− BM. *, P < 0.05; **, P < 0.01. (B, Right) Real-time RT-PCR analysis of Nfil3 mRNA expression in sorted WT BM cells at each NK developmental stage. Nfil3 expression was normalized to Gapdh. Data shown are the mean ± SD for triplicate determinations. (C) Proliferation of BM NK subsets. The left shows CD3−CD122+ gated BM cells (105), analyzed for NK1.1+ (mNK) or NK1.1− (iNK) expression and BrdU incorporation. Numbers in bold indicate the number of cells in each quadrant. The right shows iNK (NK1.1+) or mNK (NK1.1−) cells (5 × 10³) and histograms for anti-BrdU staining overlaid. The control histogram was gated on CD3−CD122+NK1.1+ cells from an untreated WT mouse. Numbers indicate the percentage of BrdU+ cells as specified by the gate. Results are representative of three separate experiments. (D) Developmental markers on BM CD3−CD122+ NK cells. BM enriched for NK cells was analyzed by flow cytometry. Histogram overlays shown are gated on CD3−CD122+NKG2D+ BM cells to include both iNK and mNK populations. Red, WT; green, Nfil3−/−. Numbers indicate percentages of cells within the indicated gates (top). Fluorescence intensity values are cited in the text. Data shown are representative of three independent experiments. (E) Impaired NK cell maturation and IFN-γ production. Left, flow cytometric determination of intracellular IFN-γ production in splenocytes or NK1.1+CD3− BM cells stimulated ex vivo with mIL-2 plus mIL-12. WT, green; Nfil3−/−, red. Filled histograms indicate baseline IFN-γ production. Right, quantification of the frequencies of CD11b-expressing cells (Mac-1) and cells showing intracellular IFN-γ production (IFN). Data shown are the mean ± SD for three mice per group. (F) Impaired in vitro cytolytic activity. Yac-1 cell lysis by poly I:C–activated NK1.1+CD3− splenocytes from WT and Nfil3−/− mice was compared. The E/T ratio (2 × 10⁴ Yac-1 cells/well) was analyzed after 4 h of co-culture. For E and F, data are the mean ± SEM of triplicate experiments. *, P < 0.05; **, P < 0.01. (G) Impaired rejection in vivo. WT and Nfil3−/− mice received CFSE-labeled β2-microglobulin–deficient and WT splenocytes, and preferential killing of the MHC class I–deficient targets in spleen (SPL) and liver (LIV) was examined by flow cytometry. NK cells from Nfil3−/− mice failed to reject the donated cells. Data shown are representative of two independent experiments.
Similar articles
- PBX1 promotes development of natural killer cells by binding directly to the Nfil3 promoter.
Xu X, Zhou Y, Fu B, Zhang J, Dong Z, Zhang X, Shen N, Sun R, Tian Z, Wei H. Xu X, et al. FASEB J. 2020 May;34(5):6479-6492. doi: 10.1096/fj.202000121R. Epub 2020 Mar 19. FASEB J. 2020. PMID: 32190943 - Nfil3-independent lineage maintenance and antiviral response of natural killer cells.
Firth MA, Madera S, Beaulieu AM, Gasteiger G, Castillo EF, Schluns KS, Kubo M, Rothman PB, Vivier E, Sun JC. Firth MA, et al. J Exp Med. 2013 Dec 16;210(13):2981-90. doi: 10.1084/jem.20130417. Epub 2013 Nov 25. J Exp Med. 2013. PMID: 24277151 Free PMC article. - The basic leucine zipper transcription factor E4BP4 is essential for natural killer cell development.
Gascoyne DM, Long E, Veiga-Fernandes H, de Boer J, Williams O, Seddon B, Coles M, Kioussis D, Brady HJ. Gascoyne DM, et al. Nat Immunol. 2009 Oct;10(10):1118-24. doi: 10.1038/ni.1787. Epub 2009 Sep 13. Nat Immunol. 2009. PMID: 19749763 - E4BP4: an unexpected player in the immune response.
Male V, Nisoli I, Gascoyne DM, Brady HJ. Male V, et al. Trends Immunol. 2012 Feb;33(2):98-102. doi: 10.1016/j.it.2011.10.002. Epub 2011 Nov 8. Trends Immunol. 2012. PMID: 22075207 Review. - A minireview of E4BP4/NFIL3 in heart failure.
Velmurugan BK, Chang RL, Marthandam Asokan S, Chang CF, Day CH, Lin YM, Lin YC, Kuo WW, Huang CY. Velmurugan BK, et al. J Cell Physiol. 2018 Nov;233(11):8458-8466. doi: 10.1002/jcp.26790. Epub 2018 Jun 1. J Cell Physiol. 2018. PMID: 29856483 Review.
Cited by
- Natural killer cell activation enhances immune pathology and promotes chronic infection by limiting CD8+ T-cell immunity.
Lang PA, Lang KS, Xu HC, Grusdat M, Parish IA, Recher M, Elford AR, Dhanji S, Shaabani N, Tran CW, Dissanayake D, Rahbar R, Ghazarian M, Brüstle A, Fine J, Chen P, Weaver CT, Klose C, Diefenbach A, Häussinger D, Carlyle JR, Kaech SM, Mak TW, Ohashi PS. Lang PA, et al. Proc Natl Acad Sci U S A. 2012 Jan 24;109(4):1210-5. doi: 10.1073/pnas.1118834109. Epub 2011 Dec 13. Proc Natl Acad Sci U S A. 2012. PMID: 22167808 Free PMC article. - The natural killer cell response and tumor debulking are associated with prolonged survival in recurrent glioblastoma patients receiving dendritic cells loaded with autologous tumor lysates.
Pellegatta S, Eoli M, Frigerio S, Antozzi C, Bruzzone MG, Cantini G, Nava S, Anghileri E, Cuppini L, Cuccarini V, Ciusani E, Dossena M, Pollo B, Mantegazza R, Parati EA, Finocchiaro G. Pellegatta S, et al. Oncoimmunology. 2013 Mar 1;2(3):e23401. doi: 10.4161/onci.23401. Oncoimmunology. 2013. PMID: 23802079 Free PMC article. - NFIL3 contributes to cytotoxic T lymphocyte-mediated killing.
Douanne T, Strege K, Del Castillo Velasco-Herrera M, Rochussen AM, Adams DJ, Griffiths GM. Douanne T, et al. Open Biol. 2024 Feb;14(2):230456. doi: 10.1098/rsob.230456. Epub 2024 Feb 28. Open Biol. 2024. PMID: 38412963 Free PMC article. - E4BP4-mediated inhibition of T follicular helper cell differentiation is compromised in autoimmune diseases.
Wang Z, Zhao M, Yin J, Liu L, Hu L, Huang Y, Liu A, Ouyang J, Min X, Rao S, Zhou W, Wu H, Yoshimura A, Lu Q. Wang Z, et al. J Clin Invest. 2020 Jul 1;130(7):3717-3733. doi: 10.1172/JCI129018. J Clin Invest. 2020. PMID: 32191636 Free PMC article. - Cytokine-Based Generation of CD49a+Eomes-/+ Natural Killer Cell Subsets.
Ni X, Fu B, Zhang J, Sun R, Tian Z, Wei H. Ni X, et al. Front Immunol. 2018 Sep 25;9:2126. doi: 10.3389/fimmu.2018.02126. eCollection 2018. Front Immunol. 2018. PMID: 30319610 Free PMC article.
References
Publication types
MeSH terms
Substances
LinkOut - more resources
Full Text Sources
Molecular Biology Databases
Research Materials


