Angiotensin II type 1 and type 2 receptors regulate basal skeletal muscle microvascular volume and glucose use - PubMed (original) (raw)
Comparative Study
Angiotensin II type 1 and type 2 receptors regulate basal skeletal muscle microvascular volume and glucose use
Weidong Chai et al. Hypertension. 2010 Feb.
Abstract
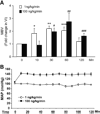
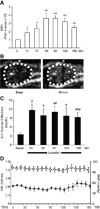
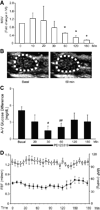
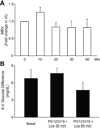
Angiotensin II causes vasoconstriction via the type 1 receptor (AT(1)R) and vasodilatation through the type 2 receptor (AT(2)R). Both are expressed in muscle microvasculature, where substrate exchanges occur. Whether they modulate basal muscle microvascular perfusion and substrate metabolism is not known. We measured microvascular blood volume (MBV), a measure of microvascular surface area and perfusion, in rats during systemic infusion of angiotensin II at either 1 or 100 ng/kg per minute. Each caused a significant increase in muscle MBV. Likewise, administration of the AT(1)R blocker losartan increased muscle MBV by >3-fold (P<0.001). Hindleg glucose extraction and muscle interstitial oxygen saturation simultaneously increased by 2- to 3-fold. By contrast, infusing AT(2)R antagonist PD123319 significantly decreased muscle MBV by >or=80% (P<0.001). This was associated with a significant decrease in hindleg glucose extraction and muscle oxygen saturation. AT(2)R antagonism and inhibition of NO synthase each blocked the losartan-induced increase in muscle MBV and glucose uptake. In conclusion, angiotensin II acts on both AT(1)R and AT(2)R to regulate basal muscle microvascular perfusion. Basal AT(1)R tone restricts muscle MBV and glucose extraction, whereas basal AT(2)R activity increases muscle MBV and glucose uptake. Pharmacological manipulation of the balance of AT(1)R and AT(2)R activity affords the potential to improve glucose metabolism.
Figures
Fig. 1
Ang II infusion increases muscle MBV independent of changes in blood pressure. Panel A. Changes in muscle MBV. Panel B. Changes in MAP. Compared with basal level, * p<0.02, ** p<0.001, *** p<0.005, # p<0.02, ## p<0.05, ### p<0.03. n = 4 for 100 ng/kg/min and 7 for 1 ng/kg/min.
Fig. 2
AT2R activity increases muscle MBV and glucose extraction. Each rat received an intravenous injection of losartan (0.3 mg/kg) at time 0 to block AT1R activity and to reveal AT2R activity. Panel A: Changes in muscle MBV. Panel B: Example of CEU images before and after losartan injection. Dotted line denotes the region of interest. Panel C. Changes in hindleg A-V glucose differences. Panel D: Femoral artery blood flow (FBF, closed circle) and mean arterial blood pressure (MAP, open circle). n=6. Compared to baseline (time 0) * p<0.01, ** p<0.001, # p<0.05, ## p<0.02, ### p<0.01.
Fig. 3
AT1R activity decreases muscle MBV and glucose extraction. Each rat received continuous intravenous infusion of PD123319 (50 µg/kg/min), began at time 0, to block AT2R activity and to reveal AT1R activity. Panel A: Changes in muscle MBV. Panel B: Example of CEU images before and 60 min after initiation of PD123319 infusion. Dotted line denotes the region of interest. Panel C: Changes in hindleg A-V glucose differences. Panel D: Femoral artery flow (FBF, closed circle) and mean arterial blood pressure (MAP, open circle). n=4–7. Compared to baseline (time 0) * p<0.001, # p<0.004, ## p<0.01.
Fig. 4
AT2R blockade abolishes losartan-induced increase in muscle MBV and glucose extraction. Each rat received an intravenous injection of losartan (0.3 mg/kg) 10 min after the initiation of a continuous intravenous infusion of PD123319 (50 µg/kg/min). Panel A: Changes in muscle MBV. Panel B: Changes in hindleg A-V glucose differences. n=5.
Fig. 5
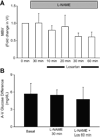
Inhibition of NOS abrogates losartan-induced increase in muscle MBV and glucose extraction. Each rat received an intravenous injection of losartan (0.3 mg/kg) 30 min after the initiation of a continuous intravenous infusion of L-NAME (50 µg/kg/min). Panel A: Changes in muscle MBV. Panel B: Changes in hindleg A-V glucose differences. n=4.
Fig. 6
AT1R blockade increases while AT2R blockade decreases muscle interstitial oxygenation. Each rat received either an intravenous injection of losartan (0.3 mg/kg) or a continuous intravenous infusion of PD123319 (50 µg/kg/min). n=5–6.
Fig. 7
Proposed mechanisms of Ang II action in muscle microvasculature. Solid line – stimulation. Dashed line – inhibition.
Similar articles
- Angiotensin II receptors modulate muscle microvascular and metabolic responses to insulin in vivo.
Chai W, Wang W, Dong Z, Cao W, Liu Z. Chai W, et al. Diabetes. 2011 Nov;60(11):2939-46. doi: 10.2337/db10-1691. Epub 2011 Sep 6. Diabetes. 2011. PMID: 21896931 Free PMC article. - Losartan increases muscle insulin delivery and rescues insulin's metabolic action during lipid infusion via microvascular recruitment.
Wang N, Chai W, Zhao L, Tao L, Cao W, Liu Z. Wang N, et al. Am J Physiol Endocrinol Metab. 2013 Mar 1;304(5):E538-45. doi: 10.1152/ajpendo.00537.2012. Epub 2013 Jan 8. Am J Physiol Endocrinol Metab. 2013. PMID: 23299501 Free PMC article. - Acute, local infusion of angiotensin II impairs microvascular and metabolic insulin sensitivity in skeletal muscle.
Premilovac D, Attrill E, Rattigan S, Richards SM, Kim J, Keske MA. Premilovac D, et al. Cardiovasc Res. 2019 Mar 1;115(3):590-601. doi: 10.1093/cvr/cvy225. Cardiovasc Res. 2019. PMID: 30192915 Free PMC article. - Muscle contraction, but not insulin, increases microvascular blood volume in the presence of free fatty acid-induced insulin resistance.
Inyard AC, Chong DG, Klibanov AL, Barrett EJ. Inyard AC, et al. Diabetes. 2009 Nov;58(11):2457-63. doi: 10.2337/db08-1077. Epub 2009 Aug 12. Diabetes. 2009. PMID: 19675134 Free PMC article. - Angiotensin II AT1 receptors preserve vasodilator reactivity in skeletal muscle resistance arteries.
Weber DS, Lombard JH. Weber DS, et al. Am J Physiol Heart Circ Physiol. 2001 May;280(5):H2196-202. doi: 10.1152/ajpheart.2001.280.5.H2196. Am J Physiol Heart Circ Physiol. 2001. PMID: 11299222
Cited by
- Molecular mechanisms and signaling pathways of angiotensin II-induced muscle wasting: potential therapeutic targets for cardiac cachexia.
Yoshida T, Tabony AM, Galvez S, Mitch WE, Higashi Y, Sukhanov S, Delafontaine P. Yoshida T, et al. Int J Biochem Cell Biol. 2013 Oct;45(10):2322-32. doi: 10.1016/j.biocel.2013.05.035. Epub 2013 Jun 13. Int J Biochem Cell Biol. 2013. PMID: 23769949 Free PMC article. Review. - Metformin prevents endothelial oxidative stress and microvascular insulin resistance during obesity development in male rats.
Liu J, Aylor KW, Chai W, Barrett EJ, Liu Z. Liu J, et al. Am J Physiol Endocrinol Metab. 2022 Mar 1;322(3):E293-E306. doi: 10.1152/ajpendo.00240.2021. Epub 2022 Feb 7. Am J Physiol Endocrinol Metab. 2022. PMID: 35128961 Free PMC article. - Mice lacking angiotensin type 2 receptor exhibit a sex-specific attenuation of insulin sensitivity.
Quiroga DT, Miquet JG, Gonzalez L, Sotelo AI, Muñoz MC, Geraldes PM, Giani JF, Dominici FP. Quiroga DT, et al. Mol Cell Endocrinol. 2019 Dec 1;498:110587. doi: 10.1016/j.mce.2019.110587. Epub 2019 Sep 17. Mol Cell Endocrinol. 2019. PMID: 31539597 Free PMC article. - Mechanistic Causes of Reduced Cardiorespiratory Fitness in Type 2 Diabetes.
Abushamat LA, McClatchey PM, Scalzo RL, Schauer I, Huebschmann AG, Nadeau KJ, Liu Z, Regensteiner JG, Reusch JEB. Abushamat LA, et al. J Endocr Soc. 2020 Jun 7;4(7):bvaa063. doi: 10.1210/jendso/bvaa063. eCollection 2020 Jul 1. J Endocr Soc. 2020. PMID: 32666009 Free PMC article. Review. - Angiotensin II receptors modulate muscle microvascular and metabolic responses to insulin in vivo.
Chai W, Wang W, Dong Z, Cao W, Liu Z. Chai W, et al. Diabetes. 2011 Nov;60(11):2939-46. doi: 10.2337/db10-1691. Epub 2011 Sep 6. Diabetes. 2011. PMID: 21896931 Free PMC article.
References
- Carey RM, Siragy HM. Newly recognized components of the renin-angiotensin system: potential roles in cardiovascular and renal regulation. Endocr Rev. 2003;24:261–271. - PubMed
- Paul M, Poyan Mehr A, Kreutz R. Physiology of local renin-angiotensin systems. Physiol Rev. 2006;86:747–803. - PubMed
- Carey RM. Cardiovascular and renal regulation by the angiotensin type 2 receptor: The AT2 receptor comes of age. Hypertension. 2005;45:840–844. - PubMed
- Liu Z. The renin-angiotensin system and insulin resistance. Current Diabetes Reports. 2007;7:34–42. - PubMed
- Batenburg WW, Garrelds IM, Bernasconi CC, Juillerat-Jeanneret L, van Kats JP, Saxena PR, Danser AHJ. Angiotensin II type 2 receptor-mediated vasodilation in human coronary microarteries. Circulation. 2004;109:2296–2301. - PubMed
Publication types
MeSH terms
Substances
Grants and funding
- R01 DK073759-04/DK/NIDDK NIH HHS/United States
- DK-073759/DK/NIDDK NIH HHS/United States
- DK-DK057878/DK/NIDDK NIH HHS/United States
- R01 DK073759/DK/NIDDK NIH HHS/United States
- R01 DK057878-09/DK/NIDDK NIH HHS/United States
- R01 DK057878/DK/NIDDK NIH HHS/United States
LinkOut - more resources
Full Text Sources
Medical
