Immunologic and virologic events in early HIV infection predict subsequent rate of progression - PubMed (original) (raw)
. 2010 Jan 15;201(2):272-84.
doi: 10.1086/649430.
Collaborators, Affiliations
- PMID: 20001854
- PMCID: PMC2939466
- DOI: 10.1086/649430
Immunologic and virologic events in early HIV infection predict subsequent rate of progression
Anuradha Ganesan et al. J Infect Dis. 2010.
Abstract
Background: Variability in human immunodeficiency virus (HIV) disease progression cannot be fully predicted by CD4(+) T cell counts or viral load (VL). Because central memory T (T(CM)) cells play a critical role in the pathogenesis of simian immunodeficiency virus disease, we hypothesized that quantifying these cells in early HIV infection could provide prognostic information.
Methods: We measured expression of CD45RO, chemokine (C-C motif) receptor (CCR) 5, CCR7, CD27, and CD28 to enumerate naive and memory subsets in samples from recently infected individuals. We also quantified proliferation, CD127 expression, and cell-associated VL. Disease progression was compared across subgroups defined by these measurements, using Kaplan-Meier survival curves and multivariate Cox proportional hazards regression.
Results: Four hundred sixty-six subjects contributed 101 events. The proportion or absolute count of T(CM) cells did not correlate with disease progression, defined as the time to AIDS or death. However, significant associations were observed for proliferation within CD4(+) or CD8(+) T cells, loss of naive or CD127(+) memory CD8(+) T cells, and CD4(+) T cell-associated VL.
Conclusions: Our results demonstrate that the extent of the immunopathogenesis established early in HIV infection predicts the course of future disease. Because antiretroviral drug treatment reverses such defects in part, our study provides mechanistic clues to why early use of antiretrovirals may prove beneficial.
Conflict of interest statement
Conflicts of interest. The authors declare that they have no financial conflicts of interest.
Figures
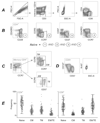
Figure 1. Representation of T cell subsets in early infection
(A) Immunophenotypic characteristics of T-cell subsets. Graphs illustrate the sequential gating to identify pure populations. The first gate eliminates doublets; the second restricts analysis to live, CD3+ T cells; within those, CD4 or CD8 T cells are identified. (B) Naïve cells were defined by defining gates within the total CD4+ or CD8+ T-cell populations, and then combining these gates with the Boolean function indicated. The resulting naïve cell population was CD45RO−CD28+CD27+CCR7+. (C) Subsets of memory CD4+ and CD8+ T cells were identified utilizing various combinations of cell-surface markers, as follows: Central memory cells (TCM) = CD45RO+ CD28+ CCR7+ CCR5−; transitional memory cells (TTM) = CD45RO+ CD28+ CCR7− CCR5+; effector memory cells (TEM) = CD45RO− CD28− CCR7− CCR5+. (D) Distribution of naïve and memory cell subsets in the CD4 and CD8 compartments. The box and whisker plot represents the relative frequencies of naïve, central, transitional, and effector memory cells in the CD4 (left panel) and CD8 (right panel) compartments. Interquartile ranges are shown.
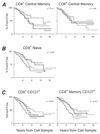
Figure 2. Relationship between T cell phenotypes and time to AIDS or death
Subjects were grouped into three groups based on the relative proportion of any given T cell subset. Kaplan-Meier survival curves are shown for the groups. The red lines show data for those individuals with the lowest levels of a particular subset (<25th percentile), green lines for those with intermediate levels (25th–75th percentile), and blue lines for those with the highest levels (>75th percentile). (A) Disease progression according to baseline CD4 (left) or CD8 (right) TCM levels. (B) Disease progression according to baseline naïve CD8 T cell levels, for individuals measured within 225 days of imputed seroconversion (left) or after 225 days (right). (C) Disease progression according to baseline expression of CD127 on total CD8 T cells (left) or on memory CD8 T cells (right).
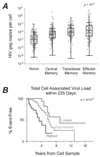
Figure 3. Association of cell associated viral load and disease progression
(A) Distribution of gag DNA within CD4+ T-cell subsets. This box and whisker plot depicts number of HIV gag DNA molecules per cell in each of the four sorted T-cell subsets. Interquartile ranges are shown. (B) Kaplan-Meier curves comparing the time to AIDS/death with levels of cell-associated DNA, for subjects identified within 225 days of imputed seroconversion.
Figure 4. Immune activation a marker of disease free survival
Kaplan-Meier curves comparing the time to AIDS/death among subjects with differing levels of Ki-67 expression in the CD4 compartment (left) or the CD8 compartment (right).
Similar articles
- T-cell dynamics during acute SIV infection.
Mattapallil JJ, Letvin NL, Roederer M. Mattapallil JJ, et al. AIDS. 2004 Jan 2;18(1):13-23. doi: 10.1097/00002030-200401020-00002. AIDS. 2004. PMID: 15090825 - CCR5 and CXCR4 expression on memory and naive T cells in HIV-1 infection and response to highly active antiretroviral therapy.
Nicholson JK, Browning SW, Hengel RL, Lew E, Gallagher LE, Rimland D, McDougal JS. Nicholson JK, et al. J Acquir Immune Defic Syndr. 2001 Jun 1;27(2):105-15. doi: 10.1097/00126334-200106010-00002. J Acquir Immune Defic Syndr. 2001. PMID: 11404531 Clinical Trial. - Distribution of naïve (CD45RA+) and memory (CD45RO+) T-cells in HIV-infected Puerto Rican population.
Roman M, Rodriguez JW, Pagán NO, Rios-Olivares E, Amill A, Hunter R. Roman M, et al. P R Health Sci J. 2002 Sep;21(3):195-201. P R Health Sci J. 2002. PMID: 12243109 - [Deep lung--cellular reaction to HIV].
Tavares Marques MA, Alves V, Duque V, Botelho MF. Tavares Marques MA, et al. Rev Port Pneumol. 2007 Mar-Apr;13(2):175-212. Rev Port Pneumol. 2007. PMID: 17492233 Review. Portuguese. - Structured treatment interruptions (STI) in chronic unsuppressed HIV infection in adults.
Pai NP, Lawrence J, Reingold AL, Tulsky JP. Pai NP, et al. Cochrane Database Syst Rev. 2006 Jul 19;2006(3):CD006148. doi: 10.1002/14651858.CD006148. Cochrane Database Syst Rev. 2006. PMID: 16856117 Free PMC article. Review.
Cited by
- Efficient quantification of HIV-1 in heparin plasma spiked with cultured HIV-1 by the Roche Cobas TaqMan and Abbott RealTime HIV-1 tests.
Jagodzinski LL, Weston HR, Liu Y, O'Connell RJ, Peel SA. Jagodzinski LL, et al. J Clin Microbiol. 2012 Aug;50(8):2804-6. doi: 10.1128/JCM.00706-12. Epub 2012 Jun 6. J Clin Microbiol. 2012. PMID: 22675128 Free PMC article. - T cell subsets in HIV infected patients after successful combination antiretroviral therapy: impact on survival after 12 years.
Rönsholt FF, Ostrowski SR, Katzenstein TL, Ullum H, Gerstoft J. Rönsholt FF, et al. PLoS One. 2012;7(7):e39356. doi: 10.1371/journal.pone.0039356. Epub 2012 Jul 17. PLoS One. 2012. PMID: 22815704 Free PMC article. Clinical Trial. - Development of neurological disease is associated with increased immune activation in simian immunodeficiency virus-infected macaques.
Dang Q, Whitted S, Goeken RM, Brenchley JM, Matsuda K, Brown CR, Lafont BA, Starost MF, Iyengar R, Plishka RJ, Buckler-White A, Hirsch VM. Dang Q, et al. J Virol. 2012 Dec;86(24):13795-9. doi: 10.1128/JVI.02174-12. Epub 2012 Oct 3. J Virol. 2012. PMID: 23035225 Free PMC article. - A benchmark for evaluation of algorithms for identification of cellular correlates of clinical outcomes.
Aghaeepour N, Chattopadhyay P, Chikina M, Dhaene T, Van Gassen S, Kursa M, Lambrecht BN, Malek M, McLachlan GJ, Qian Y, Qiu P, Saeys Y, Stanton R, Tong D, Vens C, Walkowiak S, Wang K, Finak G, Gottardo R, Mosmann T, Nolan GP, Scheuermann RH, Brinkman RR. Aghaeepour N, et al. Cytometry A. 2016 Jan;89(1):16-21. doi: 10.1002/cyto.a.22732. Epub 2015 Oct 8. Cytometry A. 2016. PMID: 26447924 Free PMC article. - Post-treatment HIV-1 controllers with a long-term virological remission after the interruption of early initiated antiretroviral therapy ANRS VISCONTI Study.
Sáez-Cirión A, Bacchus C, Hocqueloux L, Avettand-Fenoel V, Girault I, Lecuroux C, Potard V, Versmisse P, Melard A, Prazuck T, Descours B, Guergnon J, Viard JP, Boufassa F, Lambotte O, Goujard C, Meyer L, Costagliola D, Venet A, Pancino G, Autran B, Rouzioux C; ANRS VISCONTI Study Group. Sáez-Cirión A, et al. PLoS Pathog. 2013 Mar;9(3):e1003211. doi: 10.1371/journal.ppat.1003211. Epub 2013 Mar 14. PLoS Pathog. 2013. PMID: 23516360 Free PMC article.
References
- Giorgi JV, Ho HN, Hirji K, et al. CD8+ lymphocyte activation at human immunodeficiency virus type 1 seroconversion: development of HLA-DR+ CD38− CD8+ cells is associated with subsequent stable CD4+ cell levels The Multicenter AIDS Cohort Study Group. J Infect Dis. 1994;170:775–781. - PubMed
- Giorgi JV, Hultin LE, McKeating JA, et al. Shorter survival in advanced human immunodeficiency virus type 1 infection is more closely associated with T lymphocyte activation than with plasma virus burden or virus chemokine coreceptor usage. J Infect Dis. 1999;179:859–870. - PubMed
- Mellors JW, Rinaldo CR, Jr, Gupta P, White RM, Todd JA, Kingsley LA. Prognosis in HIV-1 infection predicted by the quantity of virus in plasma. Science. 1996;272:1167–1170. - PubMed
- El-Sadr WM, Lundgren JD, Neaton JD, et al. CD4+ count-guided interruption of antiretroviral treatment. N Engl J Med. 2006;355:2283–2296. - PubMed
- Kitahata MGS, Moore R. Initiating rather than Deferring HAART at a CD4+ Count >500 Cells/mm3 Is Associated with Improved Survival. Presented at the 16th Conference on Retroviruses and Opportunistic Infections; February 8 –11, 2009; Montreal, CA. 2009. Abstract number 71.
MeSH terms
Substances
Grants and funding
- HHSN261200800001C/CA/NCI NIH HHS/United States
- HHSN261200800001E/CA/NCI NIH HHS/United States
- Z99 AI999999/ImNIH/Intramural NIH HHS/United States
- ZIA AI005021-08/ImNIH/Intramural NIH HHS/United States
LinkOut - more resources
Full Text Sources
Medical
Research Materials


