Effect of hemodynamic variability on Granger causality analysis of fMRI - PubMed (original) (raw)
Effect of hemodynamic variability on Granger causality analysis of fMRI
Gopikrishna Deshpande et al. Neuroimage. 2010 Sep.
Abstract
In this work, we investigated the effect of the regional variability of the hemodynamic response on the sensitivity of Granger causality (GC) analysis of functional magnetic resonance imaging (fMRI) data to neuronal causal influences. We simulated fMRI data by convolving a standard canonical hemodynamic response function (HRF) with local field potentials (LFPs) acquired from the macaque cortex and manipulated the causal influence and neuronal delays between the LFPs, the hemodynamic delays between the HRFs, the signal-to-noise ratio (SNR), and the sampling period (TR) to assess the effect of each of these factors on the detectability of the neuronal delays from GC analysis of fMRI. In our first bivariate implementation, we assumed the worst-case scenario of the hemodynamic delay being at the empirical upper limit of its normal physiological range and opposing the direction of neuronal delay. We found that, in the absence of HRF confounds, even tens of milliseconds of neuronal delays can be inferred from fMRI. However, in the presence of HRF delays which opposed neuronal delays, the minimum detectable neuronal delay was hundreds of milliseconds. In our second multivariate simulation, we mimicked the real situation more closely by using a multivariate network of four time series and assumed the hemodynamic and neuronal delays to be unknown and drawn from a uniform random distribution. The resulting accuracy of detecting the correct multivariate network from fMRI was well above chance and was up to 90% with faster sampling. Generically, under all conditions, faster sampling and low measurement noise improved the sensitivity of GC analysis of fMRI data to neuronal causality.
Copyright (c) 2009 Elsevier Inc. All rights reserved.
Figures
Figure 1
Schematic showing the procedure to derive the four time series of the multivariate network from a single channel of LFP data, x(n). x1(n), x2(n), x3(n) and x4(n) represent the four time series derived from x(n) and d1 and d2 represent the inherent neuronal delays in the simulated system governing the relationship between the four time series
Figure 2
The multivariate network expected to be obtained from the time series x1(n), x2(n), x3(n) and x4(n)
Figure 3
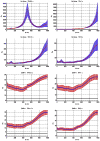
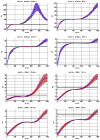
Variation of ρo, which determines the detectability of the neuronal influence in the absence of HRF confounds, as a function of neuronal delay dn, TR and noise for the case of simple delay. The black line represents the statistical threshold of _ρo_=3
Figure 4
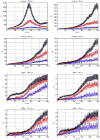
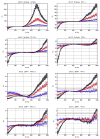
Variation of ρo, which determines the detectability of the neuronal influence in the absence of HRF confounds, as a function of neuronal delay dn, TR and noise for the case of simple delay plus intrinsic dynamics. The black line represents the statistical threshold of _ρo_=3. Blue, red and black curves represent C values of 0.5, 0.7 and 0.9, respectively
Figure 5
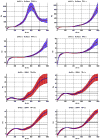
Variation of ρd, which determines the detectability of the neuronal influence in the presence of HRF confounds, as a function of neuronal delay dn, TR and noise for the case of simple delay. The hemodynamic delay _dh_=0.5 s opposed the neuronal delay dn. The black line represents the statistical threshold of _ρd_=3
Figure 6
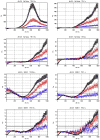
Variation of ρd, which determines the detectability of the neuronal influence in the presence of HRF confounds, as a function of neuronal delay dn, TR and noise for the case of simple delay plus intrinsic dynamics. The hemodynamic delay _dh_=0.5 s opposed the neuronal delay dn. The black line represents the statistical threshold of _ρd_=3. Blue, red and black curves represent C values of 0.5, 0.7 and 0.9, respectively.
Figure 7
Variation of ρd, which determines the detectability of the neuronal influence in the presence of HRF confounds, as a function of neuronal delay dn, TR and noise for the case of simple delay. The hemodynamic delay _dh_=2.5 s opposed the neuronal delay dn. The black line represents the statistical threshold of _ρd_=3
Figure 8
Variation of ρd, which determines the detectability of the neuronal influence in the presence of HRF confounds, as a function of neuronal delay dn, TR and noise for the case of simple delay plus intrinsic dynamics. The hemodynamic delay _dh_=2.5 s opposed the neuronal delay dn. The black line represents the statistical threshold of _ρd_=3. Blue, red and black curves represent C values of 0.5, 0.7 and 0.9, respectively.
Comment in
- The effect of intra- and inter-subject variability of hemodynamic responses on group level Granger causality analyses.
Schippers MB, Renken R, Keysers C. Schippers MB, et al. Neuroimage. 2011 Jul 1;57(1):22-36. doi: 10.1016/j.neuroimage.2011.02.008. Epub 2011 Feb 26. Neuroimage. 2011. PMID: 21316469
Similar articles
- The effect of intra- and inter-subject variability of hemodynamic responses on group level Granger causality analyses.
Schippers MB, Renken R, Keysers C. Schippers MB, et al. Neuroimage. 2011 Jul 1;57(1):22-36. doi: 10.1016/j.neuroimage.2011.02.008. Epub 2011 Feb 26. Neuroimage. 2011. PMID: 21316469 - Lag-based effective connectivity applied to fMRI: a simulation study highlighting dependence on experimental parameters and formulation.
Rodrigues J, Andrade A. Rodrigues J, et al. Neuroimage. 2014 Apr 1;89:358-77. doi: 10.1016/j.neuroimage.2013.10.029. Epub 2013 Oct 25. Neuroimage. 2014. PMID: 24513528 - Is Granger causality a viable technique for analyzing fMRI data?
Wen X, Rangarajan G, Ding M. Wen X, et al. PLoS One. 2013 Jul 4;8(7):e67428. doi: 10.1371/journal.pone.0067428. Print 2013. PLoS One. 2013. PMID: 23861763 Free PMC article. - Investigating effective brain connectivity from fMRI data: past findings and current issues with reference to Granger causality analysis.
Deshpande G, Hu X. Deshpande G, et al. Brain Connect. 2012;2(5):235-45. doi: 10.1089/brain.2012.0091. Brain Connect. 2012. PMID: 23016794 Free PMC article. Review. - Seeing patterns through the hemodynamic veil--the future of pattern-information fMRI.
Formisano E, Kriegeskorte N. Formisano E, et al. Neuroimage. 2012 Aug 15;62(2):1249-56. doi: 10.1016/j.neuroimage.2012.02.078. Epub 2012 Mar 6. Neuroimage. 2012. PMID: 22421051 Review.
Cited by
- Resting-state fMRI signals contain spectral signatures of local hemodynamic response timing.
Bailes SM, Gomez DEP, Setzer B, Lewis LD. Bailes SM, et al. Elife. 2023 Aug 11;12:e86453. doi: 10.7554/eLife.86453. Elife. 2023. PMID: 37565644 Free PMC article. - The confound of hemodynamic response function variability in human resting-state functional MRI studies.
Rangaprakash D, Barry RL, Deshpande G. Rangaprakash D, et al. Front Neurosci. 2023 Jul 14;17:934138. doi: 10.3389/fnins.2023.934138. eCollection 2023. Front Neurosci. 2023. PMID: 37521709 Free PMC article. - Resting-state fMRI signals contain spectral signatures of local hemodynamic response timing.
Bailes SM, Gomez DEP, Setzer B, Lewis LD. Bailes SM, et al. bioRxiv [Preprint]. 2023 Jan 26:2023.01.25.525528. doi: 10.1101/2023.01.25.525528. bioRxiv. 2023. PMID: 36747821 Free PMC article. Updated. Preprint. - The Dorsal Visual Pathway Represents Object-Centered Spatial Relations for Object Recognition.
Ayzenberg V, Behrmann M. Ayzenberg V, et al. J Neurosci. 2022 Jun 8;42(23):4693-4710. doi: 10.1523/JNEUROSCI.2257-21.2022. Epub 2022 May 4. J Neurosci. 2022. PMID: 35508386 Free PMC article. - Resting state fMRI connectivity is sensitive to laminar connectional architecture in the human brain.
Deshpande G, Wang Y, Robinson J. Deshpande G, et al. Brain Inform. 2022 Jan 17;9(1):2. doi: 10.1186/s40708-021-00150-4. Brain Inform. 2022. PMID: 35038072 Free PMC article.
References
- Abler B, Roebroeck A, Goebel R, Hose A, Schfnfeldt-Lecuona C, Hole G, et al. Investigating directed influences between activated brain areas in a motor-response task using fMRI. Magnetic Resonance Imaging. 2006;24:181–185. - PubMed
- Aguirre G, Zarahn E, D’Esposito M. The variability of human, BOLD hemodynamic responses. NeuroImage. 1998;8:360–369. - PubMed
- Blinowska K, Kus R, Kaminski M. Granger causality and information flow in multivariate processes. Physical Review E. 2004;70:50902–50906. - PubMed
- Buxton R. Introduction to Functional Magnetic Resonance Imaging: Principles and Techniques. New York: Cambridge University Press; 2002.
- Crochiere R, Rabiner L. Multirate Digital Signal Processing. Englewood Cliffs, NJ: Prentice-Hall; 1983.
Publication types
MeSH terms
Grants and funding
- R01 EB002009-13/EB/NIBIB NIH HHS/United States
- R01 EY012440-11/EY/NEI NIH HHS/United States
- R01 EY012440/EY/NEI NIH HHS/United States
- K24 EY017332/EY/NEI NIH HHS/United States
- R01 EB002009/EB/NIBIB NIH HHS/United States
- R01EB002009/EB/NIBIB NIH HHS/United States
- K24EY17332/EY/NEI NIH HHS/United States
- K24 EY017332-05/EY/NEI NIH HHS/United States
- R01EY12440/EY/NEI NIH HHS/United States
LinkOut - more resources
Full Text Sources
Medical
Miscellaneous


