A Raf-like MAPKKK gene DSM1 mediates drought resistance through reactive oxygen species scavenging in rice - PubMed (original) (raw)
A Raf-like MAPKKK gene DSM1 mediates drought resistance through reactive oxygen species scavenging in rice
Jing Ning et al. Plant Physiol. 2010 Feb.
Abstract
Mitogen-activated protein kinase (MAPK) cascades have been identified in various signaling pathways involved in plant development and stress responses. We identified a drought-hypersensitive mutant (drought-hypersensitive mutant1 [dsm1]) of a putative MAPK kinase kinase (MAPKKK) gene in rice (Oryza sativa). Two allelic dsm1 mutants were more sensitive than wild-type plants to drought stress at both seedling and panicle development stages. The dsm1 mutants lost water more rapidly than wild-type plants under drought stress, which was in agreement with the increased drought-sensitivity phenotype of the mutant plants. DSM1-RNA interference lines were also hypersensitive to drought stress. The predicted DSM1 protein belongs to a B3 subgroup of plant Raf-like MAPKKKs and was localized in the nucleus. By real-time PCR analysis, the DSM1 gene was induced by salt, drought, and abscisic acid, but not by cold. Microarray analysis revealed that two peroxidase (POX) genes, POX22.3 and POX8.1, were sharply down-regulated compared to wild type, suggesting that DSM1 may be involved in reactive oxygen species (ROS) signaling. Peroxidase activity, electrolyte leakage, chlorophyll content, and 3,3'-diaminobenzidine staining revealed that the dsm1 mutant was more sensitive to oxidative stress due to an increase in ROS damage caused by the reduced POX activity. Overexpression of DSM1 in rice increased the tolerance to dehydration stress at the seedling stage. Together, these results suggest that DSM1 might be a novel MAPKKK functioning as an early signaling component in regulating responses to drought stress by regulating scavenging of ROS in rice.
Figures
Figure 1.
Identification of dsm1 T-DNA insertion mutants. A, Schematic diagram of DSM1 gene and two alleles of T-DNA insertion mutants, _dsm1_-1 and _dsm1_-2. LB, Left border; RB, right border. Exons and introns are indicated in blue and white, respectively. B. RT-PCR analysis of DSM1 in ZH11, HY, _dsm1_-1, and _dsm1_-2. Actin1 was used as internal control. [See online article for color version of this figure.]
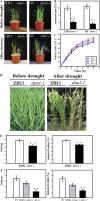
Figure 2.
Increased drought sensitivity of dsm1 at both seedling and heading stages. A, Five-leaf stage wild-type (ZH11 or HY) and dsm1 mutant plants were growing in barrels filled with a mixture of soil and sand (1:1). The left and right half of each barrel was planted with wild-type and mutant plants, respectively. Plants were not watered for 12 d, followed by rewatering for 7 d. The photograph was taken before drought stress and after recovery. B, Comparison of survival rate of wild type (ZH11 or HY) and dsm1 mutants (_dsm1_-1 [ZH11 background] or _dsm1_-2 [HY background]) after drought stress. Values are means ±
se
(n = 3). **P < 0.01 (t test). C, Water loss from detached leaves of wild type (ZH11 or HY) and dsm1 mutants (_dsm1_-1 [ZH11 background] or _dsm1_-2 [HY background]) at indicated time points. D, ZH11 and dsm1 plants were subjected to drought stress at heading stage. The photograph was taken on day 20 after rewatering. E, Spikelet fertility and yield of ZH11 and _dsm1_-1 under drought stress in paddy field with a removable rain-off shelter. Values are means ±
sd
(n = 32). **P < 0.01 (t test). F, Spikelet fertility and yield of wild type (WT; DSM1/DSM1 [ZH11 background]), heterozygous, and homozygous _dsm1_-1 under drought stress in PVC tubes filled with sandy soil. Values are means ±
sd
(n = 12). **P < 0.01 (t test).
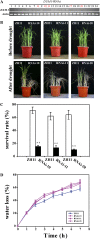
Figure 3.
Suppression of DSM1 showed increased sensitivity to drought stress. A, Transcript level of DSM1 was measured by RT-PCR in _DSM1_-RNAi plants (ZH11 background). Numbers 8, 10, 11, 17, and 20 indicated independent RNAi transgenic plants. Actin1 was used as internal control. B, Five-leaf stage ZH11 and _DSM1_-RNAi plants were subjected to no watering for 12 d, followed by rewatering for 7 d. Surviving seedlings were photographed. C, Comparison of survival rate of ZH11 and _DSM1_-RNAi plants after drought stress. Values are means ±
se
(n = 3). **P < 0.01 (t test). D, Water loss from detached leaves of ZH11 and _DSM1_-RNAi plants at indicated time points.
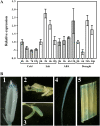
Figure 4.
Expression pattern of DSM1. A, Expression of DSM1 under abiotic stress. Two-week-old seedlings were subjected to cold (4°C), salt (200 m
m
NaCl in the hydroponic culture medium), ABA (100 μ
m
), and drought stress (removing the water supply from the plants). Relative expression levels of DSM1 were examined by quantitative real-time PCR. B, DSM1 promoter∷GUS expression patterns in transgenic rice plants (ZH11 background). GUS staining was shown in hull (1), pistil (2), stamen (3), root (4), and mature leaves (5).
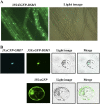
Figure 5.
Subcellular localization of DSM1. A, Subcellular localization of DSM1 in transgenic rice (ZH11 background). DSM1 cDNA was fused to GFP and the construct was expressed in transgenic rice under the control of the cauliflower mosaic virus 35S promoter. Confocal image of the root is shown. B, Subcellular localization of DSM1 in rice protoplast (ZH11 background). 35S:_sGFP_-DSM1 and 35:_sCFP_-GHD7 were cotransformed into rice etiolated shoot protoplasts. 35S:sGFP was transformed as control.
Figure 6.
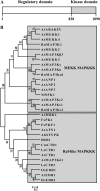
Protein sequence analysis of DSM1. A, Schematic diagram of functional domains. B, Phylogenetic tree of MAPKKK members in plants. The phylogenetic tree was created in MEGA4 software with the neighbor-joining method. Numbers indicate percentage values after 1,000 replications. Scale indicates amino acid substitutions per position. Prefixes on protein names indicate species of origin: At, Arabidopsis; Bn, Brassica napus; Nt, N. tabacum; Os, O. sativa; Le, S. lycopersicum var. lycopersicum; Cm, Cucumis melo; Fs, Fagus sylvatica; Ah, Arachis hypogaea.
Figure 7.
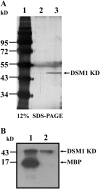
DSM1 KD displayed kinase activity. A, Silver-stained SDS-PAGE analysis of immunopurified DSM1 KD protein (with FLAG) from ZH11 (lane 2) and transgenic rice expressing DSM1 KD (lane 3). Molecular weight marker (lane 1) is indicated on the left. B, Immunopurified DSM1 KD protein was mixed with MBP (lane 1) or buffer alone (lane 2) in kinase reaction. Phosphorylated protein was analyzed by SDS-PAGE, then followed by autoradiography. The arrows indicate the position of the proteins.
Figure 8.
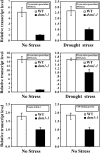
Real-time PCR analysis of four genes in the seedlings of wild type (WT) and _dsm1_-1 under normal and drought stress (with water depleted for 72 h). The rice Actin1 gene was amplified as the internal control. Primers used in PCR are listed in Supplemental Table S4.
Figure 9.
The dsm1 mutants showed hypersensitivity to oxidative stress. A, The POX activity in ZH11 and _dsm1_-1 during drought stress. Values are means ±
se
(n = 3). **P < 0.01 (t test). FW, Fresh weight. B, Analysis of MV stress-related electrolyte leakage in ZH11 and _dsm1_-1 at indicated time. Values are means ±
se
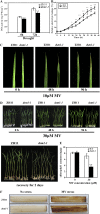
(n = 4). **P < 0.01 and *P < 0.05 (t test). C, Leaf phenotype of ZH11 and _dsm1_-1 plants (three-leaf stage) after MV stress (10 μ
m
MV for 4 d). D, Phenotype of ZH11 and _dsm1_-1 (three-leaf stage) plants after MV stress (30 μ
m
MV for 4 d and recovery for 2 d). E, Total chlorophyll contents at 96 h after 30 μ
m
MV stress. Values are means ±
se
(n = 3). **P < 0.01 (t test). WT, Wild type. F, DAB staining for H2O2 in unstressed and MV-stressed leaves of ZH11 and _dsm1_-1 plants.
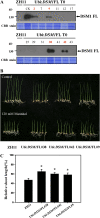
Figure 10.
Overexpression of DSM1 showed tolerance to mannitol stress. A, Western blot showed expression of DSM1-FLAG protein in the overexpression plants. Numbers 2, 9, 38, and 42 are independent overexpression transgenic plants (ZH11 background). The Coomassie Brilliant Blue-stained blot is shown as the loading control. B, Performance of ZH11 and DSM1 overexpression plants subjected to mannitol stress in MS medium with 125 m
m
mannitol. C, Relative shoot length of ZH11 and DSM1 overexpression plants under mannitol stress. Values are means ±
se
(n = 3). *P < 0.05 (t test; unstressed controls = 100).
Similar articles
- OsMIOX, a myo-inositol oxygenase gene, improves drought tolerance through scavenging of reactive oxygen species in rice (Oryza sativa L.).
Duan J, Zhang M, Zhang H, Xiong H, Liu P, Ali J, Li J, Li Z. Duan J, et al. Plant Sci. 2012 Nov;196:143-51. doi: 10.1016/j.plantsci.2012.08.003. Epub 2012 Aug 10. Plant Sci. 2012. PMID: 23017909 - Insights into Drought Stress Signaling in Plants and the Molecular Genetic Basis of Cotton Drought Tolerance.
Mahmood T, Khalid S, Abdullah M, Ahmed Z, Shah MKN, Ghafoor A, Du X. Mahmood T, et al. Cells. 2019 Dec 31;9(1):105. doi: 10.3390/cells9010105. Cells. 2019. PMID: 31906215 Free PMC article. Review. - Plant responses to water stress: role of reactive oxygen species.
Kar RK. Kar RK. Plant Signal Behav. 2011 Nov;6(11):1741-5. doi: 10.4161/psb.6.11.17729. Epub 2011 Nov 1. Plant Signal Behav. 2011. PMID: 22057331 Free PMC article. Review.
Cited by
- Two splice variants of the DsMEK1 mitogen-activated protein kinase kinase (MAPKK) are involved in salt stress regulation in Dunaliella salina in different ways.
Tang Z, Cao X, Zhang Y, Jiang J, Qiao D, Xu H, Cao Y. Tang Z, et al. Biotechnol Biofuels. 2020 Aug 19;13:147. doi: 10.1186/s13068-020-01786-w. eCollection 2020. Biotechnol Biofuels. 2020. PMID: 32843896 Free PMC article. - Enhancing Coleoptile Length of Rice Seeds under Submergence through NAL11 Knockout.
Zhao Z, Xie Y, Tian M, Liu J, Chen C, Zhou J, Guo T, Xiao W. Zhao Z, et al. Plants (Basel). 2024 Sep 17;13(18):2593. doi: 10.3390/plants13182593. Plants (Basel). 2024. PMID: 39339568 Free PMC article. - Auxin Biosynthesis Genes in Allotetraploid Oilseed Rape Are Essential for Plant Development and Response to Drought Stress.
Hao M, Wang W, Liu J, Wang H, Zhou R, Mei D, Fu L, Hu Q, Cheng H. Hao M, et al. Int J Mol Sci. 2022 Dec 9;23(24):15600. doi: 10.3390/ijms232415600. Int J Mol Sci. 2022. PMID: 36555242 Free PMC article. - Proteomic Analysis of a Rice Mutant sd58 Possessing a Novel d1 Allele of Heterotrimeric G Protein Alpha Subunit (RGA1) in Salt Stress with a Focus on ROS Scavenging.
Peng P, Gao Y, Li Z, Yu Y, Qin H, Guo Y, Huang R, Wang J. Peng P, et al. Int J Mol Sci. 2019 Jan 4;20(1):167. doi: 10.3390/ijms20010167. Int J Mol Sci. 2019. PMID: 30621186 Free PMC article. - Multi-omics approach reveals the contribution of OsSEH1 to rice cold tolerance.
Gu S, Zhuang J, Zhang Z, Chen W, Xu H, Zhao M, Ma D. Gu S, et al. Front Plant Sci. 2023 Jan 13;13:1110724. doi: 10.3389/fpls.2022.1110724. eCollection 2022. Front Plant Sci. 2023. PMID: 36714747 Free PMC article.
References
- Apel K, Hirt H (2004) Reactive oxygen species: metabolism, oxidative stress, and signal transduction. Annu Rev Plant Biol 55 373–399 - PubMed
- Asai T, Tena G, Plotnikova J, Willmann MR, Chiu WL, Gomez-Gomez L, Boller T, Ausubel FM, Sheen J (2002) MAP kinase signalling cascade in Arabidopsis innate immunity. Nature 415 977–983 - PubMed
- Bergmann DC, Lukowitz W, Somerville CR (2004) Stomatal development and pattern controlled by a MAPKK kinase. Science 304 1494–1497 - PubMed
Publication types
MeSH terms
Substances
LinkOut - more resources
Full Text Sources
Other Literature Sources
Medical
Research Materials
Miscellaneous

