ERK-dependent T cell receptor threshold calibration in rheumatoid arthritis - PubMed (original) (raw)
ERK-dependent T cell receptor threshold calibration in rheumatoid arthritis
Karnail Singh et al. J Immunol. 2009.
Abstract
Immune responses to citrullinated neoantigens and clinical efficacy of costimulation blockade indicate a general defect in maintaining T cell tolerance in rheumatoid arthritis (RA). To examine whether TCR threshold calibration contributes to disease pathogenesis, signaling in RA T cells was quantified. RA patients had a selective increase in ERK phosphorylation compared with demographically matched controls due to a mechanism distal of Ras activation. Increased ERK responses included naive and memory CD4 and CD8 T cells and did not correlate with disease activity. The augmented ERK activity delayed SHP-1 recruitment to the TCR synapse and sustained TCR-induced Zap70 and NF-kappaB signaling, facilitating responses to suboptimal stimulation. Increased responsiveness of the ERK pathway was also a characteristic finding in the SKG mouse model of RA where it preceded clinical symptoms. Treatment with subtherapeutic doses of a MEK-1/2 inhibitor delayed arthritis onset and reduced severity, suggesting that increased ERK phosphorylation predisposes for autoimmunity and can be targeted to prevent disease.
Figures
Figure 1
Increased T-cell responsiveness in RA. Purified T cells from 10 healthy age-matched controls (open boxes) and 10 RA patients (shaded boxes) were stimulated with anti-CD3/CD28 coated beads (cells: beads ratio= 2: 1), and the expression of cell surface activation markers was assessed. Results at 24 hours are shown as box plots of mean fluorescence intensities of CD69 and CD25 in CD4 and CD8 cells, CD154 in CD4 cells, and CD137 in CD8 T cells. Representative histograms are shown in Supplemental Figure 1. RA patients induced higher cell surface density of CD69 on naïve CD45RA+CD28+ and memory CD45RA− CD4 and CD8 T cells, and CD154 on CD4 T-cell populations. * p<0.05, ** p<0.01, and *** p<0.001 by two tailed Mann Whitney U test.
Figure 2
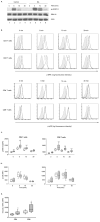
Increased activation of the ERK pathway in RA T cells. (A) T cells from healthy controls and RA patients were activated by CD3/CD28 cross-linking. Cell lysates were probed for total and phosphorylated ERK by Western blotting. Actin was probed as a loading control. Results are representative of 6 patients and 6 controls. (B) pERK and p-p38 concentrations in T cells were determined by PhosFlow before and after stimulation with anti-CD3/anti-CD28 cross-linking. Representative histograms of RA (solid lines), and healthy control T cells (dotted lines) are shown; gray fill indicate isotype control. (C) Results of 33 healthy controls (open boxes) and 33 RA patients (shaded boxes) are shown as box plots with medians, 25th and 75th percentiles as boxes, and 10th and 90th percentiles as whiskers. (D) p-p38 levels after CD3/anti-CD28 cross-linking is shown for 15 patients and 12 controls. (E) 5 minute p-ERK concentrations as shown in Figure 2C were corrected for baseline levels by subtracting basal p-ERK from the 5 minute pERK levels. Statistical analysis was done by two tailed Mann Whitney U test ** p<0.01, *** p<0.001.
Figure 3
Increased ERK activation in naïve and memory T cells. ERK phosphorylation shown in Figure 2C was analyzed for gated CD28+CD45RA+ CD4 and CD8 naïve T cells and for CD4 and CD8 memory and CD28− effector T cells from patients (shaded boxes) and controls (open boxes). * p<0.05, ** p<0.01 and *** p<0.001 by two tailed Mann Whitney U test.
Figure 4
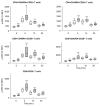
Normal early TCR signaling in RA T cells. (A) T cells from 13 healthy controls (open boxes) and 17 RA patients (shaded boxes) were activated by CD3/CD28 cross-linking and examined by PhosFlow for pZAP70. Results are shown as box plots for gated CD4 and CD8 T cells. (B) T cells from 20 healthy controls and 25 RA patients, activated by CD3/CD28 cross-linking, were analyzed for pNF-κB formation by PhosFlow. (C) T cells from 8 healthy controls and 8 RA patients were stimulated with PMA; pERK in T-cell subsets was assessed after 30 minutes. * p<0.05 and ** p<0.01 by two tailed Mann Whitney U test.
Figure 5
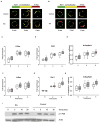
Sustained Ras-Raf complex formation in RA T cells. T cells were stimulated, fixed, and stained with antibodies for signaling molecules. Representative cells stained for Raf-1 and K-Ras (A) or N-Ras (B) are shown. In C, D, F, and G, fluorescence intensities in membrane-gated regions were quantified; results are expressed as fold-difference compared to unstimulated control cells and are shown as box plots of 75 cells from 5 patients (shaded boxes) and 5 controls (open boxes). In Figures 5E and H, co-localization of green and red fluorescence (indicated by yellow color in A, B) was examined. Fluorescence for each pixel was correlated, and the data are shown as the correlation coefficients. (I) T cells were stimulated by CD3 cross-linking; cell lysates were obtained at indicated time points and analyzed by Western blotting for p-c-Raf. Results are representative of 3 experiments with 9 RA patients and 9 controls. * p<0.05 and ** p<0.01 by two tailed Mann Whitney U test.
Figure 6
Increased pERK activity amplifies TCR signaling in RA. (A, B) Control and RA T cells were preincubated for one hour with 10 μM of ERK1/2 inhibitor (FR180204) followed by activation with anti-CD3/anti-CD28 antibody cross-linking in the continuous presence of the inhibitor. pERK (A) and p-ZAP70 (B) levels were quantified by PhosFlow. Results are shown for CD4 and CD8 T cells from 3 healthy controls (left) and 3 RA patients (right) in the presence (gray bars) or absence (open bars) of the inhibitor. (C, D) Anti-CD3 (red)-labeled T cells were pelleted with superantigen-loaded DC, fixed at indicated time points, blocked with control antibodies and stained with anti-SHP-1 (green) antibody. Representative images are shown. (E) Results from 6 RA patients and 5 controls are shown as the mean±SD intensity of CD3 (left) and SHP-1 fluorescence (right) in the gated T cell – DC contact region. Data were analyzed by two-way ANOVA. SHP-1 recruitment into the immunological synapse was significantly delayed (p<0.05). (F) T cells were stimulated with serial dilutions of anti-CD3/anti-CD28. pERK was quantified 5 minutes after stimulation. Results shown are the mean±SD of 7 experiments with 7 controls and 7 patients. Data were analyzed by two-way ANOVA. RA T cells responded to significantly lower doses of anti-CD3/CD28 (p<0.001).
Figure 7
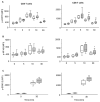
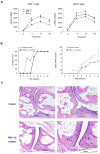
Suppression of increased ERK response in T cells from SKG mice attenuates arthritis. (A) Splenocytes from male and female SKG mice and from female BALB/c mice were obtained at the age of 2 months, stimulated with PMA, and analyzed for ERK phosphorylation at the indicated time points. Results are shown as mean±SD of 3 to 5 mice. pERK levels in SKG mice were significantly different from those in control BALB/c mice (p<0.001 by two-way ANOVA). (B) Eight-week-old SKG mice (n=12 per group) were treated with injections of 1 mg/kg of body weight of the MEK-1/2 inhibitor U0126 or a solvent control twice per week. Mice were monitored for the emergence of joint inflammation. Disease activity was defined as the sum of all inflamed joints with small inflamed joints counting 0.1 and large joints 0.5. Statistical analysis was done by two-way ANOVA. Treatment delayed disease onset (left panel) and reduced disease activity (right panel, p<0.001). (C) Representative histologies from 12 week old SKG mice treated for 4 weeks with solvent (upper panels) and MEK-1/2 inhibitor (lower panels) mice after hematoxylin and eosin staining are shown, Tissue from the MEK-1/2 inhibitor-treated mouse did not show any inflammation (score 0) while the tissue from the control-treated mouse shows synovial inflammation without cartilage or bone invasion (score 1). Magnifications of left images ×10, right images ×20.
Similar articles
- Decreased ERK and JNK signaling contribute to gene overexpression in "senescent" CD4+CD28- T cells through epigenetic mechanisms.
Chen Y, Gorelik GJ, Strickland FM, Richardson BC. Chen Y, et al. J Leukoc Biol. 2010 Jan;87(1):137-45. doi: 10.1189/jlb.0809562. Epub 2009 Oct 20. J Leukoc Biol. 2010. PMID: 19843577 Free PMC article. - Reduced arthritis in MIF deficient mice is associated with reduced T cell activation: down-regulation of ERK MAP kinase phosphorylation.
Santos LL, Dacumos A, Yamana J, Sharma L, Morand EF. Santos LL, et al. Clin Exp Immunol. 2008 May;152(2):372-80. doi: 10.1111/j.1365-2249.2008.03639.x. Epub 2008 Mar 12. Clin Exp Immunol. 2008. PMID: 18341611 Free PMC article. - The presumed hyporesponsive behavior of rheumatoid arthritis T lymphocytes can be attributed to spontaneous ex vivo apoptosis rather than defects in T cell receptor signaling.
Abreu JR, Grabiec AM, Krausz S, Spijker R, Burakowski T, Maslinski W, Eldering E, Tak PP, Reedquist KA. Abreu JR, et al. J Immunol. 2009 Jul 1;183(1):621-30. doi: 10.4049/jimmunol.0803278. Epub 2009 Jun 12. J Immunol. 2009. PMID: 19525395 - Ageing, autoimmunity and arthritis: Perturbations of TCR signal transduction pathways with ageing - a biochemical paradigm for the ageing immune system.
Fülöp T Jr, Larbi A, Dupuis G, Pawelec G. Fülöp T Jr, et al. Arthritis Res Ther. 2003;5(6):290-302. doi: 10.1186/ar1019. Epub 2003 Oct 16. Arthritis Res Ther. 2003. PMID: 14680505 Free PMC article. Review. - Mammalian target of rapamycin integrates diverse inputs to guide the outcome of antigen recognition in T cells.
Waickman AT, Powell JD. Waickman AT, et al. J Immunol. 2012 May 15;188(10):4721-9. doi: 10.4049/jimmunol.1103143. J Immunol. 2012. PMID: 22556133 Free PMC article. Review.
Cited by
- Immune aging and rheumatoid arthritis.
Goronzy JJ, Shao L, Weyand CM. Goronzy JJ, et al. Rheum Dis Clin North Am. 2010 May;36(2):297-310. doi: 10.1016/j.rdc.2010.03.001. Rheum Dis Clin North Am. 2010. PMID: 20510235 Free PMC article. Review. - Dampened ERK signaling in hematopoietic progenitor cells in rheumatoid arthritis.
Colmegna I, Pryshchep S, Oishi H, Goronzy JJ, Weyand CM. Colmegna I, et al. Clin Immunol. 2012 Apr;143(1):73-82. doi: 10.1016/j.clim.2012.01.007. Epub 2012 Jan 28. Clin Immunol. 2012. PMID: 22342385 Free PMC article. - Predicting cytotoxic T-cell age from multivariate analysis of static and dynamic biomarkers.
Rivet CA, Hill AS, Lu H, Kemp ML. Rivet CA, et al. Mol Cell Proteomics. 2011 Mar;10(3):M110.003921. doi: 10.1074/mcp.M110.003921. Epub 2010 Dec 30. Mol Cell Proteomics. 2011. PMID: 21193537 Free PMC article. - pERK-dependent defective TCR-mediated activation of CD4+ T cells in end-stage renal disease patients.
Huang L, Litjens NHR, Kannegieter NM, Klepper M, Baan CC, Betjes MGH. Huang L, et al. Immun Ageing. 2017 Jun 19;14:14. doi: 10.1186/s12979-017-0096-1. eCollection 2017. Immun Ageing. 2017. PMID: 28642802 Free PMC article. - Hallmarks of the aging T-cell system.
Zhang H, Weyand CM, Goronzy JJ. Zhang H, et al. FEBS J. 2021 Dec;288(24):7123-7142. doi: 10.1111/febs.15770. Epub 2021 Mar 3. FEBS J. 2021. PMID: 33590946 Free PMC article. Review.
References
- Firestein GS. Evolving concepts of rheumatoid arthritis. Nature. 2003;423:356–361. - PubMed
- Goronzy JJ, Weyand CM. Rheumatoid arthritis. Immunol Rev. 2005;204:55–73. - PubMed
- Holers VM. Are anti-cyclic citrullinated peptide antibodies pathogenic in rheumatoid arthritis? Nat Clin Pract Rheumatol. 2006;2:400–401. - PubMed
- Klareskog L, Widhe M, Hermansson M, Ronnelid J. Antibodies to citrullinated proteins in arthritis: pathology and promise. Curr Opin Rheumatol. 2008;20:300–305. - PubMed
Publication types
MeSH terms
Substances
Grants and funding
- R01 AG015043-11/AG/NIA NIH HHS/United States
- R01 AR41974/AR/NIAMS NIH HHS/United States
- R01 AI044142/AI/NIAID NIH HHS/United States
- R01 AR041974/AR/NIAMS NIH HHS/United States
- R01 EY11916/EY/NEI NIH HHS/United States
- R01 AR041974-14/AR/NIAMS NIH HHS/United States
- U19 AI057266-068181/AI/NIAID NIH HHS/United States
- R01 AI44142/AI/NIAID NIH HHS/United States
- U19 AI57266/AI/NIAID NIH HHS/United States
- R01AR42527/AR/NIAMS NIH HHS/United States
- R01 EY011916/EY/NEI NIH HHS/United States
- R01 AG015043/AG/NIA NIH HHS/United States
- U19 AI057266/AI/NIAID NIH HHS/United States
- R01 AR042527/AR/NIAMS NIH HHS/United States
- R01 AR042527-15/AR/NIAMS NIH HHS/United States
- R01 AI044142-10/AI/NIAID NIH HHS/United States
- R01AG15043/AG/NIA NIH HHS/United States
- R01 EY011916-08/EY/NEI NIH HHS/United States
LinkOut - more resources
Full Text Sources
Medical
Research Materials
Miscellaneous

