NR2F1 and IRE1beta suppress microsomal triglyceride transfer protein expression and lipoprotein assembly in undifferentiated intestinal epithelial cells - PubMed (original) (raw)
NR2F1 and IRE1beta suppress microsomal triglyceride transfer protein expression and lipoprotein assembly in undifferentiated intestinal epithelial cells
Kezhi Dai et al. Arterioscler Thromb Vasc Biol. 2010 Mar.
Abstract
Objective: Our aim was to elucidate mechanisms involved in the acquisition of lipid transport properties during enterocyte differentiation.
Methods and results: We show that lipid mobilization via apolipoprotein B lipoproteins is dependent on the expression of microsomal triglyceride transfer protein (MTP) during differentiation of Caco-2 cells into enterocyte-like cells. Mechanistic studies showed that binding of the nuclear receptor family 2 group F member 1 (NR2F1) to the DR1 element in the MTTP promoter suppresses MTTP expression in undifferentiated cells. During cellular differentiation, NR2F1 expression and its binding to MTTP promoter decline and MTP induction ensues. Moreover, undifferentiated cells express inositol-requiring enzyme 1beta (IRE1beta), a protein that posttranscriptionally degrades MTP mRNA, and its expression substantially decreases during differentiation, contributing to MTP induction. Immunohistochemical studies revealed a significant negative relationship between the expressions of MTP and NR2F1/IRE1beta in undifferentiated and differentiated Caco-2 cells, as well as in crypt-villus and jejunum-colon axes of mouse intestine.
Conclusions: We propose that transcriptional and posttranscriptional mechanisms involving NR2F1 and IRE1beta ensure low MTP expression in undifferentiated intestinal cells and avoid apolipoprotein B lipoprotein biosynthesis.
Figures
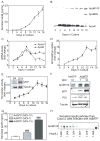
Figure 1. MTP expression and apoB-lipoprotein secretion are enhanced during differentiation
(A–E) Conditioned media from Caco-2 cells cultured in Transwells were collected on alternate days for apoB measurements in triplicate (A) and Western blot detection of immunoprecipitated apoB and apoAI (B). RNA was isolated on indicated days and expression of apoB and apoAI (C) as well as MTP (D) was quantified with qRT-PCR using acidic ribosomal phosphoprotein 0 (ARPp0) as an internal control. Ratios of candidate mRNA and ARPp0 on day 2 were normalized to 1, and expression on other days is presented as fold changes. MTP activity was determined using a triglyceride transfer assay , and by Western analysis (E and inset). (F–H) Caco-2 cells seeded at 30% confluence in 6-well plates. The next morning cells were infected with AdGFP and AdMTP at indicated multiplicity of infection (MOI). Next day, growth media were replaced with DMEM containing 10% FBS and 100 μCi/mL 35S Met/Cys. After 16 h, apoB was immunoprecipitated with 10 μL of 1D1 antibody from 1 mL of media, separated on 5% polyacrylamide gels, and visualized using PhosphorImage (F, apoB100). Unlabeled cells were used to detect intracellular MTP, PDI, and tubulin by Western blotting (F). The conditioned media were used to quantify apoB with ELISA (G). About 4 mL of growth media from cells infected with AdMTP (MOI:10) and metabolically labeled was subject to density gradient ultracentrifugation to fractionate lipoproteins. ApoB was visualized after immunoprecipitation in each fraction (H). Mean ± SEM. ###, p < 0.001, one-way ANOVA.
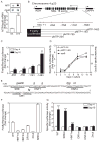
Figure 2. HNF1, HNF4, and DR1 cis elements are required for MTP expression during differentiation
(A) Nuclei (5 × 10⁶) from day 4 and 14 cultures were labeled with digoxigenin-UTP at 37°C for 30 minutes. The nascent RNA was hybridized to MTP and apoB48 cDNA cross-linked to nylon membranes. The RNA-DNA complexes were visualized using monoclonal antibodies against digoxigenin (Roche) and anti-mouse Alexa Fluor 633 antibody (top panel). Data from 3 experiments are presented as fold change compared to day 4 (bottom panel). (B) A scheme showing the MTTP locus and four constructs with different 5′ ends cloned in a pGL2-Basic background so that expression of firefly luciferase was now under the control of MTP promoter sequences (B). ADH, alcohol dehydrogenase; DAPP1, dual adaptor of phosphotyrosine and 3-phosphoinositides 1 (C) Each promoter construct was transiently transfected along with pCMV-RL that served as a transfection control. Cellular luciferase activities were measured after 4 or 14 days and ratios of firefly/Renilla luciferase were obtained. Units are presented as fold change of pMTP-204 ratio on day 4. (D) Cells stably expressing pMTP-204 or -1483 were cultured for 14 days. The specific luciferase activities (light unit/mg/sec) were presented as fold change from day 4. In addition, apoB secretion was determined using ELISA. (E–G) cis elements SRE, HNF1, HNF4, and DR1 in the 204-bp promoter were subjected to site-directed mutagenesis. Mutant sequences are shown above the original (E). Activities of wild type and mutant promoters were evaluated in Caco-2 cells by transient co-transfection with pCMV-RL, a transfection control (F). Caco-2 cells stably expressing WT pMTP-204 and different mutant sequences were cultured for 4 or 10 days (F). Specific luciferase activities (light unit/mg/sec) on day 4 were normalized to 1. Mean ± SEM; *, p < 0.05, **, p < 0.01, ***, p < 0.001, Student t test.
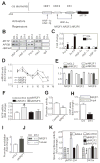
Figure 3. NR2F1 supresses MTP expression in undifferentiated cells
(A) Illustration of HNF1, HNF4, and DR1 elements in the 204-bp MTTP promoter. Activators and repressors that could bind to these elements were identified using MatInspector (Genomatix). (B–C) Caco-2 cells were cross-linked (1% formaldehyde, 15 min, room temperature), sonicated, and incubated with specific antibodies against various DNA-binding proteins. The immunoprecipitated DNA fragments were amplified using primers targeted to MTTP, HNF4A, and APOB promoters and subjected to semiquantitative (B) or quantitative (C) PCR. Binding of different factors to MTTP promoter was normalized with their binding to apoB (C). Pol II, polymerase II; IgG, normal goat serum IgG; Input, 1% of total DNA (D) Expression of repressors during differentiation was determined by measuring mRNAs using qRT-PCR. (E, F) Undifferentiated Caco-2 cells were transfected with different siRNAs against NR2F1, NR2F2, and NR2F6. After 48 h, expressions of these repressors (E) and endogenous MTP (F) were determined. (G) Caco-2 cells were co-transfected with pMTP-204 and pCMV-RL, a transfection control, along with pMT2-NR2F1 (plasmid expressing NR2F1) or pcDNA3.1 (control). Luciferase activities were measured 48 h later. (H–I) ChIP followed by regular (inset) and qPCR determined NR2F1 binding to MTTP promoter in day 4 and 14 Caco-2 cells (H). Changes in acetylation of MTTP promoter were evaluated using Ac-H3 antibodies (sc-8655) (I). (J) Immunoblotting evaluated nuclear NR2F1 protein in Caco-2 cell cultures before (D4) and after (D14) differentiation. Tubulin was a control. (K) Undifferentiated Caco-2 cells stably transfected with pMTP-204 or the same plasmid carrying mutant DR1 element (DR1m) were transfected with different siRNAs. Luciferase activities were measured using same amounts of protein. Data were normalized with siControl treated cells. Mean ± SEM; #, p < 0.05, ###, p < 0.001, One-way ANOVA; **, p < 0.01, ***, p < 0.001, Student t test.
Figure 4. IRE1β expression is reduced during differentiation
(A) IRE1β and ARPp0 mRNA were quantified and ratios on day 2 were normalized to 1. Fold change in IRE1β mRNA during Caco-2 cell differentiation is shown. (B) Caco-2 cells were fixed (1% formaldehyde, 30 min), treated with methanol (5 minutes), blocked with PBS containing 1% horse serum and 3% BSA (30 minutes), incubated (1 h) first with antibody against IRE1β (sc-20575) in blocking buffer and then with anti-calnexin (sc-11397). Two secondary antibodies, anti-rabbit Alexa Fluor 555 and anti-goat Alexa Fluor 488, were added and incubated (45 min). Nuclear DNA was stained with Topro3 blue (Invitrogen). Scale bar, 10 μm. (C) Cells were treated with different siRNA and mRNA levels of IRE1α, IRE1β, MTP, and apoB were determined. Data were normalized to siGL2 and presented as means ± SEM. (D) Caco-2 cells (100-mm dishes) were transfected with siGL2, siNR2F1, and siIRE1β, alone or in combination. Intracellular MTP and GAPDH were determined with Western blotting. Cells were labeled with 35S-methionine/cysteine and secreted apoB and apoAI were immunopreciptated with 1D1 or 4H1 antibodies , respectively. Bands were scanned and quantified using ImageQuant (lower panel). Representative bands from 2 separate experiments are shown in the upper panel. (E) Hypothetical model of intestinal MTP regulation. NR2F1 and IRE1β suppress MTTP expression via transcriptional and post-transcriptional mechanisms. These two regulatory proteins might restrict MTP expression and chylomicron production in undifferentiated/dividing intestinal cells.
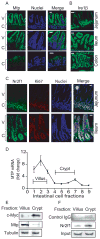
Figure 5. Mtp, Ire1β and Nr2f1 expression in mouse intestine
Frozen mouse proximal jejunum, distal ileum, and colon were sectioned (10 μm) and processed for staining as in Figure 4B. (A–B) Goat anti-MTP (sc-331166) (A) and IRE1β (sc-10512) (B) were incubated (1h) with sections. Anti-goat Alexa Flour 488 antibody was added and nuclei were stained with Topro3 blue. Bar, 100 μm; C, crypt; V, villus (C) Goat anti-NR2F1 and rabbit anti-Ki67 (Vector Labs, Burlingame, CA) antibodies were used for staining the intestinal sections. (D–F) Mouse jejunum (n=3, 16 cm from duodenum) was incubated with 1% EDTA for various times to separate villus and crypt cells from the intestinal wall as described in Supplementary Materials and Methods. Mtp mRNA was determined with qRT-PCR (D). Cells representing villi (fractions 1–3) and crypts (fractions 4–7) were pooled and presence of c-Myc, Mtp, and tubulin was determined by western blotting (E). Binding of NR2F1 to the MTTP promoter in villus and crypt cells was analyzed by ChIP followed by regular PCR. Goat serum IgGs were used as a negative control (F).
Similar articles
- NR2F1 disrupts synergistic activation of the MTTP gene transcription by HNF-4α and HNF-1α.
Dai K, Hussain MM. Dai K, et al. J Lipid Res. 2012 May;53(5):901-908. doi: 10.1194/jlr.M025130. Epub 2012 Feb 22. J Lipid Res. 2012. PMID: 22357705 Free PMC article. - IRE1beta inhibits chylomicron production by selectively degrading MTP mRNA.
Iqbal J, Dai K, Seimon T, Jungreis R, Oyadomari M, Kuriakose G, Ron D, Tabas I, Hussain MM. Iqbal J, et al. Cell Metab. 2008 May;7(5):445-55. doi: 10.1016/j.cmet.2008.03.005. Cell Metab. 2008. PMID: 18460335 Free PMC article. - Microsomal triglyceride transfer protein in CaCo-2 cells: characterization and regulation.
Mathur SN, Born E, Murthy S, Field FJ. Mathur SN, et al. J Lipid Res. 1997 Jan;38(1):61-7. J Lipid Res. 1997. PMID: 9034200 - Progress towards understanding the role of microsomal triglyceride transfer protein in apolipoprotein-B lipoprotein assembly.
Gordon DA, Jamil H. Gordon DA, et al. Biochim Biophys Acta. 2000 Jun 26;1486(1):72-83. doi: 10.1016/s1388-1981(00)00049-4. Biochim Biophys Acta. 2000. PMID: 10856714 Review. - New approaches to target microsomal triglyceride transfer protein.
Hussain MM, Bakillah A. Hussain MM, et al. Curr Opin Lipidol. 2008 Dec;19(6):572-8. doi: 10.1097/MOL.0b013e328312707c. Curr Opin Lipidol. 2008. PMID: 18957879 Free PMC article. Review.
Cited by
- Impact of high fat diet on long non-coding RNAs and messenger RNAs expression in the aortas of ApoE(-/-) mice.
Bao MH, Luo HQ, Chen LH, Tang L, Ma KF, Xiang J, Dong LP, Zeng J, Li GY, Li JM. Bao MH, et al. Sci Rep. 2016 Oct 4;6:34161. doi: 10.1038/srep34161. Sci Rep. 2016. PMID: 27698357 Free PMC article. - Diurnal regulation of MTP and plasma triglyceride by CLOCK is mediated by SHP.
Pan X, Zhang Y, Wang L, Hussain MM. Pan X, et al. Cell Metab. 2010 Aug 4;12(2):174-86. doi: 10.1016/j.cmet.2010.05.014. Cell Metab. 2010. PMID: 20674862 Free PMC article. - β-Apo-10'-carotenoids Modulate Placental Microsomal Triglyceride Transfer Protein Expression and Function to Optimize Transport of Intact β-Carotene to the Embryo.
Costabile BK, Kim YK, Iqbal J, Zuccaro MV, Wassef L, Narayanasamy S, Curley RW Jr, Harrison EH, Hussain MM, Quadro L. Costabile BK, et al. J Biol Chem. 2016 Aug 26;291(35):18525-35. doi: 10.1074/jbc.M116.738336. Epub 2016 Jul 8. J Biol Chem. 2016. PMID: 27402843 Free PMC article. - Sepsis: multiple abnormalities, heterogeneous responses, and evolving understanding.
Iskander KN, Osuchowski MF, Stearns-Kurosawa DJ, Kurosawa S, Stepien D, Valentine C, Remick DG. Iskander KN, et al. Physiol Rev. 2013 Jul;93(3):1247-88. doi: 10.1152/physrev.00037.2012. Physiol Rev. 2013. PMID: 23899564 Free PMC article. - Insights from human congenital disorders of intestinal lipid metabolism.
Levy E. Levy E. J Lipid Res. 2015 May;56(5):945-62. doi: 10.1194/jlr.R052415. Epub 2014 Nov 11. J Lipid Res. 2015. PMID: 25387865 Free PMC article. Review.
References
- Scoville DH, Sato T, He XC, Li L. Current view: intestinal stem cells and signaling. Gastroenterology. 2008 March;134:849–64. - PubMed
- Traber PG, Silberg DG. Intestine-specific gene transcription. Annu Rev Physiol. 1996;58:275–97. - PubMed
- Hussain MM, Shi J, Dreizen P. Microsomal triglyceride transfer protein and its role in apolipoprotein B-lipoprotein assembly. J Lipid Res. 2003;44:22–32. - PubMed
- Hussain MM, Iqbal J, Anwar K, Rava P, Dai K. Microsomal triglyceride transfer protein: a multifunctional protein. Front Biosci. 2003;8:S500–S506. - PubMed
- Hussain MM, Glick JM, Rothblat GH. In vitro model systems: Cell cultures used in lipid and lipoprotein research. Curr Opin Lipidol. 1992;3:173–8.
Publication types
MeSH terms
Substances
Grants and funding
- R01 DK046900/DK/NIDDK NIH HHS/United States
- DK-46900/DK/NIDDK NIH HHS/United States
- R01 DK046900-13/DK/NIDDK NIH HHS/United States
- R29 DK046900/DK/NIDDK NIH HHS/United States
- R56 DK046900/DK/NIDDK NIH HHS/United States
LinkOut - more resources
Full Text Sources


