Intestinal CD103+, but not CX3CR1+, antigen sampling cells migrate in lymph and serve classical dendritic cell functions - PubMed (original) (raw)
Intestinal CD103+, but not CX3CR1+, antigen sampling cells migrate in lymph and serve classical dendritic cell functions
Olga Schulz et al. J Exp Med. 2009.
Abstract
Chemokine receptor CX3CR1(+) dendritic cells (DCs) have been suggested to sample intestinal antigens by extending transepithelial dendrites into the gut lumen. Other studies identified CD103(+) DCs in the mucosa, which, through their ability to synthesize retinoic acid (RA), appear to be capable of generating typical signatures of intestinal adaptive immune responses. We report that CD103 and CX3CR1 phenotypically and functionally characterize distinct subsets of lamina propria cells. In contrast to CD103(+) DC, CX3CR1(+) cells represent a nonmigratory gut-resident population with slow turnover rates and poor responses to FLT-3L and granulocyte/macrophage colony-stimulating factor. Direct visualization of cells in lymph vessels and flow cytometry of mouse intestinal lymph revealed that CD103(+) DCs, but not CX3CR1-expressing cells, migrate into the gut draining mesenteric lymph nodes (LNs) under steady-state and inflammatory conditions. Moreover, CX3CR1(+) cells displayed poor T cell stimulatory capacity in vitro and in vivo after direct injection of cells into intestinal lymphatics and appeared to be less efficient at generating RA compared with CD103(+) DC. These findings indicate that selectively CD103(+) DCs serve classical DC functions and initiate adaptive immune responses in local LNs, whereas CX3CR1(+) populations might modulate immune responses directly in the mucosa and serve as first line barrier against invading enteropathogens.
Figures
Figure 1.
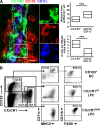
CX3CR1 and CD103 characterize distinct sets of LP mononuclear cells. (A) 50-µm cryosections of CX3CR1+/GFP mice were stained for CD11c and CD103 and analyzed by confocal microscopy. The image shows an orthogonal projection of a 7.5-µm z-stack depicting CX3CR1/GFP (green), CD103 (red), and CD11c (blue). The boxed region is shown in detail in split channels. The dashed lines indicate the epithelial border/basal lamina. Bar, 10 µm. The localization of CX3CR1/GFP+ and CD103+CD11c+ cells in the proximal ileum with respect to the basal epithelium and their numbers were determined using 7-µm-thick cryosections documented by epifluorescence microscopy. Diagrams depict mean and 25th and 75th percentiles as boxes. Sections obtained from four mice in two independent experiments were evaluated and a total of 116 CD103+ and 584 CX3CR1+ cells were analyzed. ***, P < 0.001. (B) Flow cytometric analysis of CX3CR1+/GFP LPCs. CD103+ DCs express very low levels of CX3CR1 and were identified by subgating the CD103+CX3CR1−/low population on CD11c+MHCII+ cells. CD11clow/−MHCII− cells in this plot are removed when gating on CD3−CD19− cells, suggesting they are T cells (not depicted). CX3CR1+ LPCs could be further subgrouped into CX3CR1int and CX3CR1high LPC populations. All three populations were analyzed for expression of CD11b and F4/80. Numbers indicate mean percentage (SD) of cells in the respective gate of 10 mice analyzed in at least four independent experiments. The total percentage of CD103+ DC among CD45+ cells is 1.9% (SD, 1).
Figure 2.
CX3CR1+ LPCs, but not CD103+ DCs, display long-term persistence in small bowel transplants. (A) CD45.2+ intestinal fragments were grafted into CD45.1+ recipients and analyzed by fluorescence microscopy. 6 d after transplantation, the majority of CD11c+MHCII+ (arrows) cells in the grafted tissue did not express CD45.2, i.e., had been replaced by host cells. In contrast, CD11c+ cells with low MHCII signal (arrowheads) were mostly CD45.2+, which is indicative of donor origin and long-term persistence in the grafted tissue. Bars, 50 µm. Six mice were analyzed in six experiments. (B) Intestinal fragments were grafted from CX3CR1+/GFP donors into WT recipients. 9 d after transplantation, the number of CX3CR1/GFP+ cells in the grafted tissue was enumerated by epifluorescence microscopy and compared with unmanipulated CX3CR1+/GFP mice (control). Error bars represent SD. Bars, 20 µm. Two mice were analyzed in two experiments. (C) CX3CR1+/GFP mice were injected i.p. with 2 mg BrdU and, 9 h later, the percentage of BrdU-positive CD103+ DC and CX3CR1+ LPC was determined by flow cytometry. Six mice were analyzed in three independent experiments. Error bars represent SEM. Results were obtained with a Wilcoxon signed rank test. *, P < 0.05.
Figure 3.
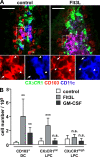
CX3CR1+ LPC and CD103+ DC display different responsiveness to Flt3L and GM-CSF in vivo. Melanoma cells secreting Flt3L or GM-CSF were injected subcutaneously into CX3CR1+/GFP mice and animals were sacrificed 6–12 d later. (A) 12 d after injection of Flt3L-secreting tumor cells, confocal microscopy revealed massive expansion of intestinal CD103+ DC but not CX3CR1+ LPC. Images show representative stainings for CX3CR1/GFP (green), CD103 (red), and CD11c (blue). The boxed region in split channels is shown on the bottom. Arrowheads indicate CD11c+CD103+ LP DC and arrows mark CD11c−CD103+ cells, most likely representing T cells. Three mice were analyzed in three independent experiments. Bars, 20 µm. (B) The total number of isolated CD103+ DC, CX3CR1high LPC, and CX3CR1int LPC in tumor-bearing mice was determined by flow cytometry. Mean (SD) is shown of at least six mice per group analyzed in two (GM-CSF) and three (Flt3L) independent experiments. Results were obtained with an unpaired Student's t test. **, P < 0.01; ***, P < 0.001.
Figure 4.
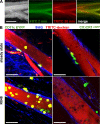
R848 administration mobilizes CD11c/YFP+, but not CX3CR1/GFP+, cells into MLN-afferent lymph. (A) Visualization of MLN-afferent lymphatics. 1 h after gavage of 200 µl of olive oil, lymphatics appear as bright/white vessels running in parallel to mesenteric blood vessels (left). FITC- and TRITC-labeled dextran injected i.v. 2 and 30 min before analysis (green and red, respectively) can differentially highlight blood vessels or both blood vessels and lymphatics. In the merge (right) image, blood vessels appear yellow and lymph vessels red. Bar, 1 mm. (B) Two-photon microscopy of MLN-afferent lymphatics of CD11c-EYFP and CX3CR1+/GFP mice in the steady state or 5 h after oral administration of R848. TRITC-labeled dextran was injected i.v. 30 min before mice were sacrificed to visualize the vessel lumen (red). Collagen-rich vessel walls display a second harmonic signal (blue). The images show orthogonal projections of 20-µm-thick (CD11c-EYFP mice) or 5-µm-thick (CX3CR1/GFP mice) volumes. Bars, 50 µm. CD11c-positive cells were readily detectable in steady-state lymphatics (top left, green) and in increased numbers 5 h after gavage of 10 µg R848 (bottom left). CX3CR1-positive cells typically occurred in the shape of stellate morphology cells on the outside of vessel tubes or within the vessel wall (top right). Cells not expressing the reporter GFP/YFP appeared as TRITC-excluding shadows in the lumen. Pictures shown are from non–Peyer's Patch draining lymphatics. The following numbers of independent experiments were each performed with single mice: CD11c-EYFP, five; CD11c-EYFP+R848, two; CX3CR1+/GFP, four; and CX3CR1+/GFP+R848, five.
Figure 5.
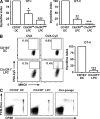
R848 administration mobilizes CD103+ DC, but not CX3CR1+ LPC, into MLN-afferent lymph. (A) Lymph was collected from MLN-afferent vessels 5 h after oral administration of R848 and analyzed by flow cytometry. MHCII+CD11c− cells express CD19 and, most likely, represent B cells exiting from GALT (not depicted). Results are representative of six experiments. (B) Frequencies of CD103+ DC, CX3CR1int LPC, and CX3CR1high LPC 16 h after oral administration of R848 as determined by flow cytometry. CX3CR1high LPCs were not detected (n.d.) in the MLN. Cell numbers observed in untreated mice were normalized to 1. Bars indicate the according fold change of the mean. Errors bars indicate SD. Four mice per group were analyzed in two independent experiments. Results were obtained with an unpaired Student's t test. **, P < 0.01.
Figure 6.
CX3CR1+ LPCs fail to efficiently induce T cell proliferation in vitro and in vivo. (A) OT-I or OT-II cells were co-cultured with peptide-loaded CD103+ DC, CX3CR1int LPC, or CX3CR1high LPC at a ratio of 10:1 for 3 d. Proliferation was determined by thymidine incorporation assay and is depicted as a percentage of the mean T cell proliferation in CD103+ DC co-cultures (thymidine index). Results are the mean (SEM) of three or more independent experiments using pooled cells from four to five mice per experiment. Data were analyzed using one sample Student's t test, compared with CD103+ DC. Co-cultures of LPC/T cells at a 1:2 ratio showed a similarly inefficient induction of T cell proliferation compared with the 1:10 ratio (not depicted). *, P < 0.05; **, P < 0.01; ***, P < 0.001. (B) 500 µg of unlabeled or Cy5-labeled OVA was injected into the gut lumen of anaesthetized CX3CR1+/GFP mice. 1 h later, mice were sacrificed and Cy5 fluorescence in CD103+ DC and CX3CR1+ LPC was determined by flow cytometry. Dot plots are gated on CD103+ DC or MHCII+CX3CR1+ LPC as indicated. Gates were adjusted to contain 0.1% of positive cells in controls (injected with unlabeled OVA) and numbers indicate the proportion of Cy5-positive cells. Data are representative of five mice analyzed in three independent experiments. CD103+ DC and CX3CR1high LPC from OVA-Cy5–injected mice were sorted 1 h after injection and co-cultured with OT-II T cells for 3 d at a ratio of 1:10. Cells were pulsed with 1 µCi [3H]thymidine 18 h before collection, and thymidine incorporation was quantified in a β counter. Bars represent pooled data obtained in two independent experiments. Error bars indicate SEM. Results were obtained with a one-sample Student's t test. ***, P < 0.001. (C) 107 CFSE-labeled DO11.10 cells were adoptively transferred to BALB/c recipients. 1 d later, 5,000 peptide-loaded CD103+ DCs or CX3CR1+ LPCs were injected into the MLN-afferent lymphatics. Proliferating antigen-specific T cells were detected in the MLN 3 d after injection. Plots are gated on live CD4+ cells. Control mice received 20 mg OVA by gavage. Results are representative of two independent experiments.
Figure 7.
CX3CR1+ LPCs display weak ALDH activity and fail to efficiently induce CCR9 on responding CD8 T cells. (A) Aldh1a2 expression of sorted CD103+ DC, CX3CR1int LPC, and CX3CR1high LPC was assessed by real-time PCR. The mean (horizontal lines) was obtained from three separate experiments using pooled cells from five to eight mice per experiment. Results were obtained with an unpaired Student's t test. **, P < 0.01; ***, P < 0.001. (B and C) ALDH activity on sorted CD103+ DC and MHCII+F4/80+CD11b+ LPC with or without addition of inhibitor. (B and C) Representative stainings (B) and mean (C; horizontal lines) of five individual mice (symbols). Results were obtained with a paired Student's t test. **, P < 0.01. (D) CFSE-labeled OT-I cells were co-cultured with peptide-loaded CD103+ DC, CX3CR1high LPC, or CX3CR1int LPC at a ratio of 2:1 for 3.5 d and expression of CCR9 on responding OT-I cells was analyzed. Results are representative of two experiments.
Similar articles
- Luminal bacteria recruit CD103+ dendritic cells into the intestinal epithelium to sample bacterial antigens for presentation.
Farache J, Koren I, Milo I, Gurevich I, Kim KW, Zigmond E, Furtado GC, Lira SA, Shakhar G. Farache J, et al. Immunity. 2013 Mar 21;38(3):581-95. doi: 10.1016/j.immuni.2013.01.009. Epub 2013 Feb 7. Immunity. 2013. PMID: 23395676 Free PMC article. - Origin of the lamina propria dendritic cell network.
Bogunovic M, Ginhoux F, Helft J, Shang L, Hashimoto D, Greter M, Liu K, Jakubzick C, Ingersoll MA, Leboeuf M, Stanley ER, Nussenzweig M, Lira SA, Randolph GJ, Merad M. Bogunovic M, et al. Immunity. 2009 Sep 18;31(3):513-25. doi: 10.1016/j.immuni.2009.08.010. Epub 2009 Sep 10. Immunity. 2009. PMID: 19733489 Free PMC article. - Intestinal CD103(-) dendritic cells migrate in lymph and prime effector T cells.
Cerovic V, Houston SA, Scott CL, Aumeunier A, Yrlid U, Mowat AM, Milling SW. Cerovic V, et al. Mucosal Immunol. 2013 Jan;6(1):104-13. doi: 10.1038/mi.2012.53. Epub 2012 Jun 20. Mucosal Immunol. 2013. PMID: 22718260 - Subsets of migrating intestinal dendritic cells.
Milling S, Yrlid U, Cerovic V, MacPherson G. Milling S, et al. Immunol Rev. 2010 Mar;234(1):259-67. doi: 10.1111/j.0105-2896.2009.00866.x. Immunol Rev. 2010. PMID: 20193024 Review. - How vitamin A metabolizing dendritic cells are generated in the gut mucosa.
Agace WW, Persson EK. Agace WW, et al. Trends Immunol. 2012 Jan;33(1):42-8. doi: 10.1016/j.it.2011.10.001. Epub 2011 Nov 11. Trends Immunol. 2012. PMID: 22079120 Review.
Cited by
- Inflammation switches the differentiation program of Ly6Chi monocytes from antiinflammatory macrophages to inflammatory dendritic cells in the colon.
Rivollier A, He J, Kole A, Valatas V, Kelsall BL. Rivollier A, et al. J Exp Med. 2012 Jan 16;209(1):139-55. doi: 10.1084/jem.20101387. Epub 2012 Jan 9. J Exp Med. 2012. PMID: 22231304 Free PMC article. - Molecular and cellular mechanisms of food allergy and food tolerance.
Chinthrajah RS, Hernandez JD, Boyd SD, Galli SJ, Nadeau KC. Chinthrajah RS, et al. J Allergy Clin Immunol. 2016 Apr;137(4):984-997. doi: 10.1016/j.jaci.2016.02.004. J Allergy Clin Immunol. 2016. PMID: 27059726 Free PMC article. Review. - Neuroimmune interactions: dendritic cell modulation by the sympathetic nervous system.
Takenaka MC, Guereschi MG, Basso AS. Takenaka MC, et al. Semin Immunopathol. 2017 Feb;39(2):165-176. doi: 10.1007/s00281-016-0590-0. Epub 2016 Oct 31. Semin Immunopathol. 2017. PMID: 27800584 Review. - Toll-like receptor mediated modulation of T cell response by commensal intestinal microbiota as a trigger for autoimmune arthritis.
Rogier R, Koenders MI, Abdollahi-Roodsaz S. Rogier R, et al. J Immunol Res. 2015;2015:527696. doi: 10.1155/2015/527696. Epub 2015 Feb 23. J Immunol Res. 2015. PMID: 25802876 Free PMC article. Review. - The intestinal immune system and gut barrier function in obesity and ageing.
Shemtov SJ, Emani R, Bielska O, Covarrubias AJ, Verdin E, Andersen JK, Winer DA. Shemtov SJ, et al. FEBS J. 2023 Sep;290(17):4163-4186. doi: 10.1111/febs.16558. Epub 2022 Jul 1. FEBS J. 2023. PMID: 35727858 Free PMC article. Review.
References
- Arques J.L., Hautefort I., Ivory K., Bertelli E., Regoli M., Clare S., Hinton J.C., Nicoletti C. 2009. Salmonella induces flagellin- and MyD88-dependent migration of bacteria-capturing dendritic cells into the gut lumen. Gastroenterology. 137:579–587: 587: e1–e2 10.1053/j.gastro.2009.04.010 - DOI - PubMed
Publication types
MeSH terms
Substances
LinkOut - more resources
Full Text Sources
Other Literature Sources
Molecular Biology Databases
Research Materials


