Preferential associations between co-regulated genes reveal a transcriptional interactome in erythroid cells - PubMed (original) (raw)
doi: 10.1038/ng.496. Epub 2009 Dec 13.
Tom Sexton, Lyubomira Chakalova, Nathan F Cope, Alice Horton, Simon Andrews, Sreenivasulu Kurukuti, Jennifer A Mitchell, David Umlauf, Daniela S Dimitrova, Christopher H Eskiw, Yanquan Luo, Chia-Lin Wei, Yijun Ruan, James J Bieker, Peter Fraser
Affiliations
- PMID: 20010836
- PMCID: PMC3237402
- DOI: 10.1038/ng.496
Preferential associations between co-regulated genes reveal a transcriptional interactome in erythroid cells
Stefan Schoenfelder et al. Nat Genet. 2010 Jan.
Abstract
The discovery of interchromosomal interactions in higher eukaryotes points to a functional interplay between genome architecture and gene expression, challenging the view of transcription as a one-dimensional process. However, the extent of interchromosomal interactions and the underlying mechanisms are unknown. Here we present the first genome-wide analysis of transcriptional interactions using the mouse globin genes in erythroid tissues. Our results show that the active globin genes associate with hundreds of other transcribed genes, revealing extensive and preferential intra- and interchromosomal transcription interactomes. We show that the transcription factor Klf1 mediates preferential co-associations of Klf1-regulated genes at a limited number of specialized transcription factories. Our results establish a new gene expression paradigm, implying that active co-regulated genes and their regulatory factors cooperate to create specialized nuclear hot spots optimized for efficient and coordinated transcriptional control.
Figures
Figure 1
Genes interchromosomally co-associate in transcription factories. (a) Triple-label RNA immuno-FISH of gene pairs and RNAPII factories. RNAPII-S5P staining is in red and RNA FISH signals are in green and blue, as indicated, for each gene pair. Side panels show enlarged images of the colocalizing FISH signals (top to bottom: triple label, blue and green, red and green, red and blue). Scale bar, 2 μm. (b,c) Bar charts showing percentages of RNA FISH signals that associate with an RNAPII factory (b) and percentages of colocalizing RNA FISH signals that co-associate within the same RNAPII focus (c). (d) Scatter plot showing distributions of RNA FISH colocalization frequencies for genes in cis (red) and trans (black) with Hba and Hbb. (e) Representative double-label RNA FISH in definitive erythroid cells for several erythroid-expressed genes (green) and Hba or Hbb (red), as indicated, with DAPI staining in blue. Colocalization frequencies are shown on each panel, and co-associations in cis are labeled. Scale bar, 2 μm.
Figure 2
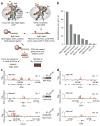
e4C detects known and heretofore uncharacterized genomic co-associations with Hbb in cis and trans. (a) Overview of the e4C method. Nuclei are cross-linked, and the chromatin is digested with BglII as in conventional 3C, before immunoprecipitation with an antibody recognizing RNAPII-S5P. DNA ligation is performed on the immunoprecipitated chromatin under dilute conditions that favor ligation between DNA strands within cross-linked complexes. After reversal of the cross-links and DNA purification, a biotinylated primer (brown) specific to the bait gene (red) is used for primer extension into adjacent ligation products (blue). Biotinylated extension products are purified on streptavidin-coated magnetic beads (red sphere), digested with NlaIII and ligated to an adaptor (green). e4C products are amplified by PCR with a nested, bait-specific primer (yellow) and an adaptor-specific primer (green). e4C products are then analyzed by cloning and sequencing, or hybridization to a custom microarray. (b) Bar chart showing the enrichments of erythroid-expressed Hba, Slc4a1 and Ahsp sequences after ChIP using an antibody recognizing RNAPII-S5P. Enrichments of nonexpressed _Nefm (_formerly Nef3) and Igh VH16 sequences are shown as negative controls. Enrichments are shown relative to the VH16 control. (c) Hbb e4C microarray profiles for three ~2-Mb regions of genomic sequence in cis to Hbb, centered on Ahsp, Uros and P2ry6, showing the running mean enrichments of e4C signal over genomic signal for 100-kilobase (kb) windows. Black bars denote the positions of genes within these regions. Insets show PCR products for ligation products between Hbb and Ahsp, Uros or P2ry6 on water (−), 3C or RNAPII-S5P ChIP-3C templates. (d) Hbb e4C microarray profiles for three ~2 Mb regions of genomic sequence in trans to Hbb, centered on Slc4a1, Cd47 and Fech, showing the running mean enrichments of e4C signal over genomic signal for 100-kb windows.
Figure 3
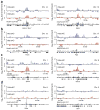
Specificity of interchromosomal transcriptional networks. Hba (blue) and Hbb (red) e4C microarray profiles for ~2 Mb regions of genomic sequence in trans to both globin genes, showing the running mean enrichments of e4C signal over genomic signal for 100-kb windows. (a–d) Profiles are centered on genes identified by e4C as interacting with both Hba and Hbb (Epb4.9, Xpo7 and Spnb1) (a), interacting with Hba (Hnrpk and Pigq) (b), interacting with Hbb (Spna1 and Fbxo9) (c) and interacting with neither globin gene (Gypa and B2m) (d). Positions of genes and RNAPII-S5P ChIP-PET profiles (black) are shown below the e4C microarray profiles.
Figure 4
Validation of the e4C assay. (a) Scatter plot showing distributions of all erythroid-expressed genes (gray dots), Hbb e4C hits (red) and Hba e4C hits (blue), ranked by RNAPII-S5P PET density. Horizontal lines represent the median, 25th and 75th percentiles. (b) Validation of e4C by interchromosomal RNA FISH colocalization frequencies with Hba and Hbb. Genes identified by e4C as associating with Hba are highlighted in blue, Hbb e4C–associating genes are in red and non-hit genes in gray. P values are for differences in colocalization frequencies between e4C hit and non-hit genes.
Figure 5
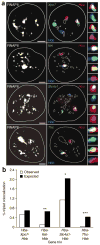
Co-association of three active genes within the same transcription factory. (a) Quadruple-label RNA immuno-FISH of three transcribed genes and RNAPII factories. RNAPII-S5P staining is shown in the panels on the left; RNA FISH signals in the same cells are shown in red (Hba), blue (Hbb) and green (top to bottom: Xpo7, Kel, Slc4a1, Tfrc) in the panels on the right. Side panels show enlarged images of the colocalizing FISH signals (top to bottom: triple label, blue and green, red and green, red and blue). Scale bar, 2 μm. (b) Bar chart showing the observed versus expected frequencies of gene triplet associations at a shared transcription factory. *P < 0.05; **P < 0.005; ***P < 0.001.
Figure 6
Ectopic genes enter endogenous transcriptional networks. (a) Representative double-label RNA FISH for HBB transgenes (red) and endogenous Hba or Hbb genes (green) in definitive erythroid cells from transgenic lines (as indicated at top right of each panel), DAPI staining in blue. Scale bar, 2 μm. (b) Interchromosomal colocalization frequencies between HBB and Hba (blue bars) and HBB and Hbb (red bars) from six transgenic lines. Fold differences in transgene colocalization with Hbb versus Hba are shown along with the corresponding indicators of P values *P < 0.05; **P < 0.005; ***P < 0.001.
Figure 7
Co-regulated genes cluster in specialized transcription factories. (a) Immunofluorescence staining for Klf1 in definitive erythroid cells. Klf1 is shown in red, DAPI in blue. Note nonerythroid, Klf1-negative cell (bottom) demonstrating antibody specificity. Scale bar, 2 μm. (b) Immunofluorescence detection of Klf1 (red) and RNAPII-S5P (green) in definitive erythroid cells. Scale bar, 2 μm. (c) Double-label RNA immuno-FISH of nascent transcripts (green) and Klf1 foci (red). Side panels show enlarged images of selected nascent transcript signals with corresponding red channel (Klf1). Scale bar, 2 μm. (d) Graph showing proportions of RNA FISH signals found associated with Klf1 foci (black), or not associated with Klf1 foci (white). Green line shows ‘background’ association level of 20%, based on proportions of transcription factories containing high levels of Klf1. Indicators of P values are shown for Klf1 association frequencies higher than the background level (***P < 0.001). (e) Triple-label RNA immuno-FISH for pairs of nascent transcripts (blue and green, as indicated) and Klf1 foci (red). Side panels show enlarged images of the colocalizing FISH signals (top to bottom: triple label, blue and green, red and green, red and blue). Scale bar, 2 μm. (f) Graph showing proportions of colocalized pairs of RNA FISH signals found associated with Klf1 foci (black) or not associated with Klf1 foci (white). Green line shows ‘background’ association level of 20%, based on proportions of transcription factories containing high levels of Klf1. Indicators of P values are shown for increase in _Hbb_-Cpox Klf1 association frequency compared with Cpox Klf1 association frequency, and for decreases in globin-Hist1h3f Klf1 and globin-Tubb5 Klf1 association frequencies compared to globin Klf1 association frequencies (**P < 0.005; ***P < 0.001).
Figure 8
Klf1 mediates specific intra- and interchromosomal co-associations. (a–c) 3C analyses of genomic associations in definitive erythroid cells derived from wild-type (+/+), heterozygous (+/−) and _Klf1_-null (−/−) mice, including karyoview showing positions of the genes tested. The lower band in all lanes represents the loading control. Shown are 3C products between Klf1-regulated gene pairs as indicated (a); between Klf1-independent controls (ligation between two adjacent fragments in the Calr gene was used as a positive control, and association between Hbb and P2ry6 served as a negative control; see Fig. 2c) (b); and between Hba and Klf1-independent genes. M, DNA size marker (c). (d) Double-label DNA immuno-FISH of Hbb (red) and RNAPII-S5P (green). WT, wild type. Scale bar, 2 μm. (e) Graph showing proportions of DNA FISH signals found associated with transcription factories in WT and Klf1−/− fetal liver cells, with the corresponding indicators of P values (*P < 0.05; **P < 0.005; ***P < 0.001). (f) Bar chart showing RNA FISH colocalization frequencies of the indicated gene pairs in WT and Klf1−/− cells. (g) Bar chart showing DNA FISH colocalization frequencies of the indicated gene pairs in WT and Klf1−/− cells. (h) Model of dynamic associations between genes in specialized transcription factories. Schematic representation of two cells that could represent the same cell at different times, or two cells with differing genome conformations within a population. Transcription factories are depicted as blue dots; Klf1-containing transcription factories are shown as red dots. Chromatin loops containing Klf1-regulated genes (aubergine segments) from the same or different chromosomes territories (colored areas) preferentially co-transcribe in the limited number of specialized Klf1-containing transcription factories. Temporarily nontranscribed alleles are positioned away from transcription factories. We propose that interactions between transcription network members are dynamic and may change over time, which may influence chromosomal conformations and chromosome positioning.
Comment in
- Getting connected in the globin interactome.
Ragoczy T, Groudine M. Ragoczy T, et al. Nat Genet. 2010 Jan;42(1):16-7. doi: 10.1038/ng0110-16. Nat Genet. 2010. PMID: 20037614
Similar articles
- Getting connected in the globin interactome.
Ragoczy T, Groudine M. Ragoczy T, et al. Nat Genet. 2010 Jan;42(1):16-7. doi: 10.1038/ng0110-16. Nat Genet. 2010. PMID: 20037614 - A global role for KLF1 in erythropoiesis revealed by ChIP-seq in primary erythroid cells.
Tallack MR, Whitington T, Yuen WS, Wainwright EN, Keys JR, Gardiner BB, Nourbakhsh E, Cloonan N, Grimmond SM, Bailey TL, Perkins AC. Tallack MR, et al. Genome Res. 2010 Aug;20(8):1052-63. doi: 10.1101/gr.106575.110. Epub 2010 May 27. Genome Res. 2010. PMID: 20508144 Free PMC article. - Differential regulation of the α-globin locus by Krüppel-like Factor 3 in erythroid and non-erythroid cells.
Funnell AP, Vernimmen D, Lim WF, Mak KS, Wienert B, Martyn GE, Artuz CM, Burdach J, Quinlan KG, Higgs DR, Whitelaw E, Pearson RC, Crossley M. Funnell AP, et al. BMC Mol Biol. 2014 May 16;15:8. doi: 10.1186/1471-2199-15-8. BMC Mol Biol. 2014. PMID: 24885809 Free PMC article. - KLF1 directly coordinates almost all aspects of terminal erythroid differentiation.
Tallack MR, Perkins AC. Tallack MR, et al. IUBMB Life. 2010 Dec;62(12):886-90. doi: 10.1002/iub.404. IUBMB Life. 2010. PMID: 21190291 Review. - Mechanisms controlling activation of the alpha-globin gene domain in chicken erythroid cells.
Razin SV, Ioudinkova ES. Razin SV, et al. Biochemistry (Mosc). 2007 May;72(5):467-70. doi: 10.1134/s000629790705001x. Biochemistry (Mosc). 2007. PMID: 17573699 Review.
Cited by
- Histone deacetylation and cytosine methylation compartmentalize heterochromatic regions in the genome organization of Neurospora crassa.
Scadden AW, Graybill AS, Hull-Crew C, Lundberg TJ, Lande NM, Klocko AD. Scadden AW, et al. Proc Natl Acad Sci U S A. 2023 Nov 21;120(47):e2311249120. doi: 10.1073/pnas.2311249120. Epub 2023 Nov 14. Proc Natl Acad Sci U S A. 2023. PMID: 37963248 Free PMC article. - Heat Shock Factor 1 forms nuclear condensates and restructures the yeast genome before activating target genes.
Rubio LS, Mohajan S, Gross DS. Rubio LS, et al. Elife. 2024 Oct 15;12:RP92464. doi: 10.7554/eLife.92464. Elife. 2024. PMID: 39405097 Free PMC article. - Understanding the regulatory and transcriptional complexity of the genome through structure.
Mercer TR, Mattick JS. Mercer TR, et al. Genome Res. 2013 Jul;23(7):1081-8. doi: 10.1101/gr.156612.113. Genome Res. 2013. PMID: 23817049 Free PMC article. Review. - The radial nuclear positioning of genes correlates with features of megabase-sized chromatin domains.
Kölbl AC, Weigl D, Mulaw M, Thormeyer T, Bohlander SK, Cremer T, Dietzel S. Kölbl AC, et al. Chromosome Res. 2012 Aug;20(6):735-52. doi: 10.1007/s10577-012-9309-9. Epub 2012 Sep 28. Chromosome Res. 2012. PMID: 23053570 - Chromatin Interaction Analysis with Paired-End Tag Sequencing (ChIA-PET) for mapping chromatin interactions and understanding transcription regulation.
Goh Y, Fullwood MJ, Poh HM, Peh SQ, Ong CT, Zhang J, Ruan X, Ruan Y. Goh Y, et al. J Vis Exp. 2012 Apr 30;(62):3770. doi: 10.3791/3770. J Vis Exp. 2012. PMID: 22564980 Free PMC article.
References
- Lanctôt C, Cheutin T, Cremer M, Cavalli G, Cremer T. Dynamic genome architecture in the nuclear space: regulation of gene expression in three dimensions. Nat Rev Genet. 2007;8:104–115. - PubMed
- Volpi EV, et al. Large-scale chromatin organization of the major histocompatibility complex and other regions of human chromosome 6 and its response to interferon in interphase nuclei. J Cell Sci. 2000;113:1565–1576. - PubMed
Publication types
MeSH terms
Substances
Grants and funding
- G0800036/MRC_/Medical Research Council/United Kingdom
- BBS/E/B/0000C151/BB_/Biotechnology and Biological Sciences Research Council/United Kingdom
- BB/E017460/1/BB_/Biotechnology and Biological Sciences Research Council/United Kingdom
- BBS/E/B/0000M723/BB_/Biotechnology and Biological Sciences Research Council/United Kingdom
- R01 DK046865/DK/NIDDK NIH HHS/United States
LinkOut - more resources
Full Text Sources
Other Literature Sources
Molecular Biology Databases


