Compartmentalization and clonal amplification of HIV-1 variants in the cerebrospinal fluid during primary infection - PubMed (original) (raw)
Compartmentalization and clonal amplification of HIV-1 variants in the cerebrospinal fluid during primary infection
Gretja Schnell et al. J Virol. 2010 Mar.
Abstract
Human immunodeficiency virus type 1 (HIV-1)-associated dementia (HAD) is a severe neurological disease that affects a subset of HIV-1-infected individuals. Increased compartmentalization has been reported between blood and cerebrospinal fluid (CSF) HIV-1 populations in subjects with HAD, but it is still not known when compartmentalization arises during the course of infection. To assess HIV-1 genetic compartmentalization early during infection, we compared HIV-1 populations in the peripheral blood and CSF in 11 primary infection subjects, with analysis of longitudinal samples over the first 18 months for a subset of subjects. We used heteroduplex tracking assays targeting the variable regions of env and single-genome amplification and sequence analysis of the full-length env gene to identify CSF-compartmentalized variants and to examine viral genotypes within the compartmentalized populations. For most subjects, HIV-1 populations were equilibrated between the blood and CSF compartments. However, compartmentalized HIV-1 populations were detected in the CSF of three primary infection subjects, and longitudinal analysis of one subject revealed that compartmentalization during primary HIV-1 infection was resolved. Clonal amplification of specific HIV-1 variants was identified in the CSF population of one primary infection subject. Our data show that compartmentalization can occur in the central nervous system (CNS) of subjects in primary HIV-1 infection in part through persistence of the putative transmitted parental variant or via viral genetic adaptation to the CNS environment. The presence of distinct HIV-1 populations in the CSF indicates that independent HIV-1 replication can occur in the CNS, even early after HIV-1 transmission.
Figures
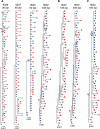
FIG. 1.
Cross-sectional and longitudinal HTA analysis of HIV-1 in the blood plasma and CSF of primary infection subjects. (A) Longitudinal V1/V2 or V4/V5 HTA analysis of HIV-1 using paired blood plasma and CSF samples from 5 subjects without compartmentalized CSF variants. The HTA shown for subject 9007 targeted the V1/V2 region of env, and the V4/V5 HTA is shown for all other subjects. Sample time points are listed above each HTA gel as days p.i. The HTA gel images for the CSF viral population of subject 9001 at 206 days p.i. and subject 9007 at 149 days p.i. are not included because there was poor reproducibility between the HTA replicates due to low CSF viral loads. (B) Longitudinal V4/V5 HTA analysis of HIV-1 using paired blood and CSF samples from 2 subjects with compartmentalized CSF variants. CSF-compartmentalized variants are indicated by filled black circles next to the gel images. A variant enriched in the CSF is indicated with a filled black square next to the gel image.
FIG. 2.
Phylogenetic analysis of plasma and CSF HIV-1 populations. (A) Phylogenetic trees of HIV-1 env sequences for subjects 9002, 9025, 9037, and 9039, which display equilibration between blood plasma and CSF HIV-1 populations. (B) Phylogenetic trees of HIV-1 env sequences for subject 9007 at 149 days p.i. (dpi) and 406 days p.i. HIV-1 populations were equilibrated at 149 days p.i. but became slightly discordant at 406 days p.i. (C) Phylogenetic tree of HIV-1 env sequences for subject 9040, which displays significant compartmentalization in the CSF. The open blue circle indicates the node of divergence for the compartmentalized CSF sequences. SGA amplicons were first aligned, and a maximum likelihood phylogenetic tree was constructed using PhyML. Bootstrap numbers ≥70 are indicated at the appropriate nodes. Sequences obtained from the CSF are labeled with solid blue circles, and plasma sequences are labeled with solid red rectangles on the tree. The genetic distances between sequences are indicated by the distance scale bars at the bottoms of the trees.
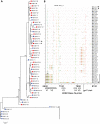
FIG. 3.
Phylogenetic and sequence analyses of plasma and CSF HIV-1 populations at 198 days p.i. for subject 9018. (A) Maximum likelihood phylogenetic tree. Sequences from the CSF (C) are labeled with solid blue circles, and plasma sequences (P) are labeled with solid red rectangles. Genetic distances between sequences are indicated by the scale bars located at the bottom of the tree. Bootstrap values of >50 are labeled at the appropriate nodes. Putative transmitted viruses are labeled with asterisks, and CSF populations that were considered compartmentalized based on the phylogenetic analysis are indicated with a solid black line. (B) Highlighter plot of aligned env plasma and CSF sequences. The HXB2 base number is indicated on the x axis, and the sequence identifier is indicated on the y axis. Base changes are indicated by the following ticks on the highlighter plot: A, green; T, red; G, orange; C, light blue; and gaps, gray.
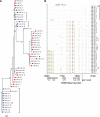
FIG. 4.
Phylogenetic and sequence analyses of subject 7146 HIV-1 populations in the plasma and CSF at 156 days p.i. (A) Maximum likelihood phylogenetic tree. Sequences from the CSF (C) are labeled with solid blue circles, and plasma sequences (P) are labeled with solid red rectangles. Bootstrap values of >50 are labeled at the appropriate nodes. Genetic distances between sequences are indicated by the scale bar located at the bottom of the tree. The clonally amplified HIV-1 variants in the CSF population are indicated by the black bracket. Putative transmitted viruses are labeled with asterisks, and CSF populations that were compartmentalized are indicated with solid black lines. (B) Highlighter plot of aligned plasma and CSF env sequences. The HXB2 base number is indicated on the x axis, and the sequence identifier is indicated on the y axis. Base changes are indicated by the following ticks on the highlighter plot: A, green; T, red; G, orange; C, light blue; and gaps, gray.
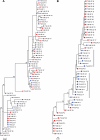
FIG. 5.
Phylogenetic analysis of subject 7146 HIV-1 populations at days 177 and 203 postinfection. (A) Phylogenetic tree of plasma and CSF HIV-1 env sequences at 177 days p.i. (B) Phylogenetic tree of HIV-1 populations at 203 days p.i. Sequences from the CSF (C) are labeled with solid blue circles, and plasma sequences (P) are labeled with solid red rectangles. The CSF sequences that were considered compartmentalized are indicated by the solid black lines. Clonally amplified HIV-1 variants in the CSF population are indicated by the black bracket. Bootstrap values of >50 are labeled at the appropriate nodes. Genetic distances between sequences are indicated by the scale bars located at the bottoms of the trees.
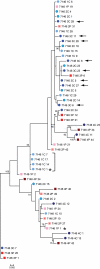
FIG. 6.
Longitudinal phylogenetic analysis of subject 7146 HIV-1 populations. Shown is a phylogenetic tree of a representative set of plasma and CSF HIV-1 env sequences from 156 days p.i. (1P, light- pink square; 1C, light-blue circle), 177 days p.i. (2P, dark-pink square; 2C, bright-blue circle with dark outline), 203 days p.i. (3P, bright-red square; 3C, royal blue circle), and 530 days p.i. (4P, dark-red-brown square; 4C, navy blue circle). CSF sequences that were clonally amplified at 156 days p.i. are indicated by the black bracket, and CSF sequences that were considered compartmentalized at 203 days p.i. are indicated with arrows. Bootstrap values of >50 are labeled at the appropriate nodes. Genetic distances between sequences are indicated by the scale bar located at the bottom of the tree.
Similar articles
- Central nervous system compartmentalization of HIV-1 subtype C variants early and late in infection in young children.
Sturdevant CB, Dow A, Jabara CB, Joseph SB, Schnell G, Takamune N, Mallewa M, Heyderman RS, Van Rie A, Swanstrom R. Sturdevant CB, et al. PLoS Pathog. 2012 Dec;8(12):e1003094. doi: 10.1371/journal.ppat.1003094. Epub 2012 Dec 27. PLoS Pathog. 2012. PMID: 23300446 Free PMC article. - Compartmentalized replication of R5 T cell-tropic HIV-1 in the central nervous system early in the course of infection.
Sturdevant CB, Joseph SB, Schnell G, Price RW, Swanstrom R, Spudich S. Sturdevant CB, et al. PLoS Pathog. 2015 Mar 26;11(3):e1004720. doi: 10.1371/journal.ppat.1004720. eCollection 2015 Mar. PLoS Pathog. 2015. PMID: 25811757 Free PMC article. Clinical Trial. - Compartmentalized human immunodeficiency virus type 1 originates from long-lived cells in some subjects with HIV-1-associated dementia.
Schnell G, Spudich S, Harrington P, Price RW, Swanstrom R. Schnell G, et al. PLoS Pathog. 2009 Apr;5(4):e1000395. doi: 10.1371/journal.ppat.1000395. Epub 2009 Apr 24. PLoS Pathog. 2009. PMID: 19390619 Free PMC article. - Molecular analysis of cerebrospinal fluid: potential for the study of HIV-1 infection of the central nervous system.
Cinque P, Bestetti A, Morelli P, Presi S. Cinque P, et al. J Neurovirol. 2000 May;6 Suppl 1:S95-S102. J Neurovirol. 2000. PMID: 10871772 Review. - Clinical implications of HIV-1 drug resistance in the neurological compartment.
Antinori A, Cingolani A, Giancola ML, Forbici F, De Luca A, Perno CF. Antinori A, et al. Scand J Infect Dis Suppl. 2003;106:41-4. doi: 10.1080/03008870310009650. Scand J Infect Dis Suppl. 2003. PMID: 15000582 Review.
Cited by
- Interplay between Wnt/β-catenin signaling and HIV: virologic and biologic consequences in the CNS.
Al-Harthi L. Al-Harthi L. J Neuroimmune Pharmacol. 2012 Dec;7(4):731-9. doi: 10.1007/s11481-012-9411-y. Epub 2012 Oct 13. J Neuroimmune Pharmacol. 2012. PMID: 23065461 Free PMC article. Review. - Laser capture microdissection assessment of virus compartmentalization in the central nervous systems of macaques infected with neurovirulent simian immunodeficiency virus.
Matsuda K, Brown CR, Foley B, Goeken R, Whitted S, Dang Q, Wu F, Plishka R, Buckler-White A, Hirsch VM. Matsuda K, et al. J Virol. 2013 Aug;87(16):8896-908. doi: 10.1128/JVI.00874-13. Epub 2013 May 29. J Virol. 2013. PMID: 23720733 Free PMC article. - A machine learning approach for identifying amino acid signatures in the HIV env gene predictive of dementia.
Holman AG, Gabuzda D. Holman AG, et al. PLoS One. 2012;7(11):e49538. doi: 10.1371/journal.pone.0049538. Epub 2012 Nov 14. PLoS One. 2012. PMID: 23166702 Free PMC article. - Human immunodeficiency virus (HIV) latency: the major hurdle in HIV eradication.
Tyagi M, Bukrinsky M. Tyagi M, et al. Mol Med. 2012 Sep 25;18(1):1096-108. doi: 10.2119/molmed.2012.00194. Mol Med. 2012. PMID: 22692576 Free PMC article. Review. - Thinking about HIV: the intersection of virus, neuroinflammation and cognitive dysfunction.
Grovit-Ferbas K, Harris-White ME. Grovit-Ferbas K, et al. Immunol Res. 2010 Dec;48(1-3):40-58. doi: 10.1007/s12026-010-8166-x. Immunol Res. 2010. PMID: 20725864 Review.
References
- Blennow, K., P. Fredman, A. Wallin, C. G. Gottfries, I. Karlsson, G. Langstrom, I. Skoog, L. Svennerholm, and C. Wikkelso. 1993. Protein analysis in cerebrospinal fluid. II. Reference values derived from healthy individuals 18-88 years of age. Eur. Neurol. 33:129-133. - PubMed
- Boisse, L., M. J. Gill, and C. Power. 2008. HIV infection of the central nervous system: clinical features and neuropathogenesis. Neurol. Clin. 26:799-819. - PubMed
- Brew, B. J., R. B. Bhalla, M. Paul, H. Gallardo, J. C. McArthur, M. K. Schwartz, and R. W. Price. 1990. Cerebrospinal fluid neopterin in human immunodeficiency virus type 1 infection. Ann. Neurol. 28:556-560. - PubMed
- Cinque, P., A. Bestetti, R. Marenzi, S. Sala, M. Gisslen, L. Hagberg, and R. W. Price. 2005. Cerebrospinal fluid interferon-gamma-inducible protein 10 (IP-10, CXCL10) in HIV-1 infection. J. Neuroimmunol. 168:154-163. - PubMed
Publication types
MeSH terms
Grants and funding
- T32 AI007001/AI/NIAID NIH HHS/United States
- R01 MH067751/MH/NIMH NIH HHS/United States
- R01 NS037660/NS/NINDS NIH HHS/United States
- P30 CA016086/CA/NCI NIH HHS/United States
- K23-MH074466/MH/NIMH NIH HHS/United States
- UL1 RR024131/RR/NCRR NIH HHS/United States
- R01-MH81772/MH/NIMH NIH HHS/United States
- UL1RR024131/RR/NCRR NIH HHS/United States
- P30-CA16086/CA/NCI NIH HHS/United States
- K23 MH074466/MH/NIMH NIH HHS/United States
- R01-NS37660/NS/NINDS NIH HHS/United States
- P30 AI050410/AI/NIAID NIH HHS/United States
- T32-AI07001/AI/NIAID NIH HHS/United States
- P30-AI50410/AI/NIAID NIH HHS/United States
- R01-MH67751/MH/NIMH NIH HHS/United States
- R01 MH081772/MH/NIMH NIH HHS/United States
LinkOut - more resources
Full Text Sources
Medical

