MreB drives de novo rod morphogenesis in Caulobacter crescentus via remodeling of the cell wall - PubMed (original) (raw)
MreB drives de novo rod morphogenesis in Caulobacter crescentus via remodeling of the cell wall
Constantin N Takacs et al. J Bacteriol. 2010 Mar.
Abstract
MreB, the bacterial actin-like cytoskeleton, is required for the rod morphology of many bacterial species. Disruption of MreB function results in loss of rod morphology and cell rounding. Here, we show that the widely used MreB inhibitor A22 causes MreB-independent growth inhibition that varies with the drug concentration, culture medium conditions, and bacterial species tested. MP265, an A22 structural analog, is less toxic than A22 for growth yet equally efficient for disrupting the MreB cytoskeleton. The action of A22 and MP265 is enhanced by basic pH of the culture medium. Using this knowledge and the rapid reversibility of drug action, we examined the restoration of rod shape in lemon-shaped Caulobacter crescentus cells pretreated with MP265 or A22 under nontoxic conditions. We found that reversible restoration of MreB function after drug removal causes extensive morphological changes including a remarkable cell thinning accompanied with elongation, cell branching, and shedding of outer membrane vesicles. We also thoroughly characterized the composition of C. crescentus peptidoglycan by high-performance liquid chromatography and mass spectrometry and showed that MreB disruption and recovery of rod shape following restoration of MreB function are accompanied by considerable changes in composition. Our results provide insight into MreB function in peptidoglycan remodeling and rod shape morphogenesis and suggest that MreB promotes the transglycosylase activity of penicillin-binding proteins.
Figures
FIG. 1.
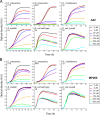
Inhibitory effects of A22 and MP265 on bacterial growth. C. crescentus CB15N, A. tumefaciens 3101, S. meliloti 1021, and E. coli PB103 and FB9 (PB103 Δ_mreB_) were grown in the presence of the noted concentrations of A22 or MP265, and the optical densities of the cultures were recorded. Cells were grown in the media indicated on the figure. Each curve represents the average optical density of at least three independent cultures.
FIG. 2.
Effects of A22 and MP265 on bacterial growth rates. The growth rate of each bacterial culture grown in the presence of a 0, 5, 25, 50, 100, 250, or 500 μM concentration of either A22 or MP265 was calculated from the exponential part of each individual growth curve (shown in Fig. 1), and divided by the average growth rate of the respective culture in the absence of any drug. The obtained relative growth rates were plotted as a function of the drug concentration added to the culture (average ± standard deviation of at least three independent values).
FIG. 3.
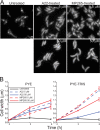
Disruptive effects of A22 and MP265 treatments on GFP-MreB localization and rod morphology of C. crescentus. (A) Synthesis of GFP-MreB was induced for 2 h in cultures of strain LS3814; then the cells were treated for 1 h with the indicated drug concentrations while induction was maintained, placed on agarose pads containing the same drug concentrations used for treatment, and imaged by light microscopy. Treatment with the 5 μM drug concentrations was performed in PYE-TRIS medium while treatment with the 50 μM drug concentrations was performed in PYE medium. (B) Wild-type CB15N cultures growing in PYE or PYE-TRIS were treated with the indicated drug concentrations. Cells harvested before the addition of the drugs and after 3 and 6 h of growth in the presence of the indicated amounts of drugs were fixed and imaged by phase-contrast microscopy. The maximum width of each cell was measured using a Matlab-based algorithm, and the mean width of 400 to 2,000 cells from each culture was determined. The plot depicts the average of the mean cell width from three independent experiments for each treatment condition as a function of the duration of the treatment.
FIG. 4.
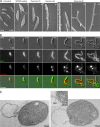
Phenotypes associated with recovery from MP265 and A22 treatment. (A) Scanning EM images of CB15N cells before MP265 treatment (i); after 4 h of treatment with 5 μM MP265 in PYE-TRIS (ii); or at 2 h (iii), 4 h (iv), and 6 h (v to vii) after removal of MP265. (B) Selected images of CJW3049 cells from a time-lapse sequence of recovery from 4 h of 5 μM MP265 treatment. Synthesis of cytoplasmic GFP and periplasm-exported mCherry was achieved by growing cells in the presence of 0.3% xylose and 0.5 mM vanillic acid for 4 h and 6 h, respectively, prior to imaging on agarose pads containing xylose and vanillic acid. Time is given as hours:minutes. (C) Transmission EM images of CB15N cells after 6 h of recovery from 4 h of 5 μM A22 treatment. OM, outer membrane.
FIG. 5.
Transmission electron micrographs of C. crescentus sacculi isolated at different time points during recovery from A22. (A) Untreated cells. (B) Cells treated for 4 h with 5 μM A22 in PYE-TRIS. (C to E) Cells after 1 h (C), 2 h (D), and 3 h (E) of recovery from a 4-h treatment with 5 μM A22 in PYE-TRIS. (F) Cells after 5 h of recovery from a 5-h treatment with 5 μM A22 in PYE-TRIS. (G) High-magnification image of a sacculus containing strongly stained striations, isolated after 3 h of recovery from a 4-h treatment with 5 μM A22 in PYE-TRIS. PHB, polyhydroxybutyrate granule trapped inside the sacculus.
FIG. 6.
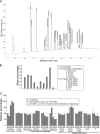
Muropeptide composition of C. crescentus PG during A22 treatment and recovery from A22 treatment. (A) UV chromatogram of HPLC-separated muropeptides isolated from the PG of CB15N cells. Peak identities determined by MS/MS: Tri, GlcNAc-MurNAc-
l
-Ala-
l
-γ-Glu-m-Dap; tetra, Tri-
d
-Ala; Penta, Tetra-
d
-Ala; Penta(Gly5), Tetra-Gly; Anh, 1,6-anhydro-MurNAc; (
d
,
l
), m-Dap-m-Dap cross-link. (B) Composition (in molar percentage) of various muropeptide species in the PG of untreated CB15N cells (mean values ± standard deviation of measurements from three independent samples). (C) Changes in the composition of C. crescentus PG during A22 treatment and recovery from treatment. The molar percentage of each species in a given sample is expressed as a percentage of the average molar percentage of the species in the PG from untreated cells. Treatment conditions are as indicated on the figure. Bars represent mean values ± standard deviation of three (U), two (T, 1, and 2), and one (3) independent PG samples.
Similar articles
- MreB, the cell shape-determining bacterial actin homologue, co-ordinates cell wall morphogenesis in Caulobacter crescentus.
Figge RM, Divakaruni AV, Gober JW. Figge RM, et al. Mol Microbiol. 2004 Mar;51(5):1321-32. doi: 10.1111/j.1365-2958.2003.03936.x. Mol Microbiol. 2004. PMID: 14982627 - The cell-shape protein MreC interacts with extracytoplasmic proteins including cell wall assembly complexes in Caulobacter crescentus.
Divakaruni AV, Loo RR, Xie Y, Loo JA, Gober JW. Divakaruni AV, et al. Proc Natl Acad Sci U S A. 2005 Dec 20;102(51):18602-7. doi: 10.1073/pnas.0507937102. Epub 2005 Dec 12. Proc Natl Acad Sci U S A. 2005. PMID: 16344480 Free PMC article. - Exploring the A22-Bacterial Actin MreB Interaction through Molecular Dynamics Simulations.
Awuni Y, Jiang S, Robinson RC, Mu Y. Awuni Y, et al. J Phys Chem B. 2016 Sep 22;120(37):9867-74. doi: 10.1021/acs.jpcb.6b05199. Epub 2016 Sep 14. J Phys Chem B. 2016. PMID: 27600765 - Shapeshifting to Survive: Shape Determination and Regulation in Caulobacter crescentus.
Woldemeskel SA, Goley ED. Woldemeskel SA, et al. Trends Microbiol. 2017 Aug;25(8):673-687. doi: 10.1016/j.tim.2017.03.006. Epub 2017 Mar 27. Trends Microbiol. 2017. PMID: 28359631 Free PMC article. Review. - Morphogenesis of rod-shaped sacculi.
den Blaauwen T, de Pedro MA, Nguyen-Distèche M, Ayala JA. den Blaauwen T, et al. FEMS Microbiol Rev. 2008 Mar;32(2):321-44. doi: 10.1111/j.1574-6976.2007.00090.x. FEMS Microbiol Rev. 2008. PMID: 18291013 Review.
Cited by
- Purification and HPLC Analysis of Cell Wall Muropeptides from Caulobacter crescentus.
Stankeviciute G, Klein EA. Stankeviciute G, et al. Bio Protoc. 2019 Nov 5;9(21):e3421. doi: 10.21769/BioProtoc.3421. eCollection 2019 Nov 5. Bio Protoc. 2019. PMID: 33654919 Free PMC article. - The Rcs stress response and accessory envelope proteins are required for de novo generation of cell shape in Escherichia coli.
Ranjit DK, Young KD. Ranjit DK, et al. J Bacteriol. 2013 Jun;195(11):2452-62. doi: 10.1128/JB.00160-13. Epub 2013 Mar 29. J Bacteriol. 2013. PMID: 23543719 Free PMC article. - Bacterial shape: two-dimensional questions and possibilities.
Young KD. Young KD. Annu Rev Microbiol. 2010;64:223-40. doi: 10.1146/annurev.micro.112408.134102. Annu Rev Microbiol. 2010. PMID: 20825347 Free PMC article. Review. - Nutritional and Volatile Characterisation of Milk Inoculated with Thermo-Tolerant Lactobacillus bulgaricus through Adaptive Laboratory Evolution.
Liang J, Yoo MJY, Seale B, Grazioli G. Liang J, et al. Foods. 2021 Nov 30;10(12):2944. doi: 10.3390/foods10122944. Foods. 2021. PMID: 34945497 Free PMC article. - Stable Regulation of Cell Cycle Events in Mycobacteria: Insights From Inherently Heterogeneous Bacterial Populations.
Logsdon MM, Aldridge BB. Logsdon MM, et al. Front Microbiol. 2018 Mar 21;9:514. doi: 10.3389/fmicb.2018.00514. eCollection 2018. Front Microbiol. 2018. PMID: 29619019 Free PMC article. Review.
References
- Aaron, M., G. Charbon, H. Lam, H. Schwarz, W. Vollmer, and C. Jacobs-Wagner. 2007. The tubulin homologue FtsZ contributes to cell elongation by guiding cell wall precursor synthesis in Caulobacter crescentus. Mol. Microbiol. 64:938-952. - PubMed
Publication types
MeSH terms
Substances
Grants and funding
- GM065835/GM/NIGMS NIH HHS/United States
- R01 GM065835/GM/NIGMS NIH HHS/United States
- GM076698/GM/NIGMS NIH HHS/United States
- HHMI/Howard Hughes Medical Institute/United States
- R01 GM076698/GM/NIGMS NIH HHS/United States
LinkOut - more resources
Full Text Sources


