Chronic peroxisome proliferator-activated receptor gamma (PPARgamma) activation of epididymally derived white adipocyte cultures reveals a population of thermogenically competent, UCP1-containing adipocytes molecularly distinct from classic brown adipocytes - PubMed (original) (raw)
Chronic peroxisome proliferator-activated receptor gamma (PPARgamma) activation of epididymally derived white adipocyte cultures reveals a population of thermogenically competent, UCP1-containing adipocytes molecularly distinct from classic brown adipocytes
Natasa Petrovic et al. J Biol Chem. 2010.
Abstract
The recent insight that brown adipocytes and muscle cells share a common origin and in this respect are distinct from white adipocytes has spurred questions concerning the origin and molecular characteristics of the UCP1-expressing cells observed in classic white adipose tissue depots under certain physiological or pharmacological conditions. Examining precursors from the purest white adipose tissue depot (epididymal), we report here that chronic treatment with the peroxisome proliferator-activated receptor gamma agonist rosiglitazone promotes not only the expression of PGC-1alpha and mitochondriogenesis in these cells but also a norepinephrine-augmentable UCP1 gene expression in a significant subset of the cells, providing these cells with a genuine thermogenic capacity. However, although functional thermogenic genes are expressed, the cells are devoid of transcripts for the novel transcription factors now associated with classic brown adipocytes (Zic1, Lhx8, Meox2, and characteristically PRDM16) or for myocyte-associated genes (myogenin and myomirs (muscle-specific microRNAs)) and retain white fat characteristics such as Hoxc9 expression. Co-culture experiments verify that the UCP1-expressing cells are not proliferating classic brown adipocytes (adipomyocytes), and these cells therefore constitute a subset of adipocytes ("brite" adipocytes) with a developmental origin and molecular characteristics distinguishing them as a separate class of cells.
Figures
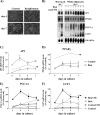
FIGURE 1.
Expression levels of marker genes during rosiglitazone-stimulated differentiation of white adipocytes. Primary cultures of white adipocytes were grown for the indicated number of days in the absence (control) or presence of 1 μ
m
rosiglitazone. Where indicated, 1 μ
m
norepinephrine (NE) had been added 2 h before harvest. A, white (pre)adipocyte cultures were examined with phase-contrast microscopy after 4 or 7 days in culture. B, representative Northern blot. Total RNA (10 μg) was used per lane, and the blot was hybridized with the aP2, PPARγ, PGC-1α, UCP1, and 18 S rRNA probes. aP2 (C), PPARγ (D), PGC-1α (E), and UCP1 (F) mRNA levels are shown during spontaneous and rosiglitazone-stimulated differentiation of white (pre)adipocyte cultures. The aP2, PPARγ, PGC-1α, and UCP1 mRNA levels were normalized to the 18 S rRNA levels in each sample. The points represent means ± S.E. of four (days 5, 6, and 7) or one (day 4) independent experiments, each performed in duplicate. Stippled lines represent corresponding expression levels in parallel cultures of non-rosiglitazone-treated brown adipocytes (as published previously (21)). The brown adipocyte control levels of aP2 and PPARγ and NE-induced levels of PGC-1α and UCP1 at day 7 were set in each experiment to 100% (indicated by arrow), and the white adipocyte aP2, PPARγ, PGC-1α, and UCP1 mRNA levels on different days were expressed relative to this value in each individual experiment. Rosiglitazone treatment significantly increased the aP2 (p < 0.001), the PGC-1α (p < 0.01), and the UCP1 (p < 0.01) mRNA levels (two-way analysis of variance with replicates; rosiglitazone treatment versus time in culture).
FIGURE 2.
Rosiglitazone does not favor growth of brown over white adipocytes. Primary cultures of white adipocytes originating from UCP1-wild-type mice (C57Bl/6) and brown adipocytes originating from UCP1-KO mice (on C57Bl/6 background) were grown for 7 days separately or in co-culture in the indicated ratios, in the absence (left panel) or presence of 1 μ
m
rosiglitazone (right panel). Where indicated, 1 μ
m
norepinephrine (NE) had been added 2 h before harvest. Note that, in these rosiglitazone-treated white adipocytes cultures (originating from C57Bl/6 mice), the UCP1 transcripts were detected only after NE stimulation. Representative Northern blots are shown (three additional experiments gave principally the same results). Total RNA (10 μg) was used per lane, and the blot was hybridized with the UCP1 and 18 S rRNA probes. Arrows indicate wild-type (WT) and knockout (KO) UCP1 transcripts. Since rosiglitazone in UCP1-KO cells induces a transcript that co-migrates with the predominant UCP1-WT transcript, the genetic identity of the cells was verified by reverse transcription-PCR (
supplemental Fig. 4
). An example of a corresponding experiment where the origins of the cells (from wild-type or UCP1-KO mice) were reversed can be seen in
supplemental Fig. 3
.
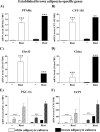
FIGURE 3.
Expression levels of established brown adipocyte marker genes in control and rosiglitazone-stimulated cultures of white and brown adipocytes. Primary cultures of white and brown adipocytes were grown for 5 days in the absence (control) or presence of 1 μ
m
rosiglitazone. Gene expression was analyzed by quantitative reverse transcription-PCR. PPARα (A), CPT-1M (B), Elovl3 (C), Cidea (D), PGC-1α (E), and UCP1 (F) levels in control and rosiglitazone-stimulated white and brown adipocytes on day 5 of culture. Hatched bars (PGC-1α and UCP1) represent values in the cells treated with 1 μ
m
NE for 2 h. The expression levels of the genes studied were normalized to the TBP levels in each sample. The values represent means ± S.E. of five independent experiments, each performed in duplicate. Expression levels in the rosiglitazone-treated brown adipocyte cultures were set in each experiment to the mean of its normalized values, and the levels in other brown and white adipocytes were expressed relative to this value in each individual experiment. The significance of rosiglitazone treatment was determined with a paired t test performed on the logarithmized expression levels of control and rosiglitazone-stimulated white and brown adipocyte cultures. ***, p < 0.001.
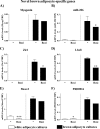
FIGURE 4.
Expression levels of novel brown adipocyte marker genes in control and rosiglitazone-stimulated cultures of white and brown adipocytes. Primary cultures of white and brown adipocytes were grown as above (Fig. 3). Gene expression was analyzed by quantitative reverse transcription-PCR. Myogenin (A), miR-206 (B), Zic1 (C), Lhx8 (D), Meox2 (E), and PRDM16 (F) levels in control and rosiglitazone-stimulated white and brown adipocytes on day 5 of culture are shown. The expression levels of the genes studied were normalized to the TBP levels in each sample. The values represent means ± S.E. of four independent experiments, each performed in duplicate. Expression levels in the rosiglitazone-treated brown adipocyte cultures were set in each experiment to the mean of its normalized values, and the levels in other brown and white adipocytes were expressed relative to this value in each individual experiment. Statistical analysis is as in Fig. 3. *, p < 0.05; **, p < 0.01; ***, p < 0.001.
FIGURE 5.
Expression levels of white-adipocyte marker genes in control and rosiglitazone-stimulated cultures of white and brown adipocytes. Primary cultures of white and brown adipocytes were grown as above (Figs. 3 and 4). Gene expression was analyzed by quantitative reverse transcription-PCR. Igfbp3 (A), DPT (B), Tcf21 (C), and Hoxc9 (D) levels are shown in control and rosiglitazone-stimulated white and brown adipocytes on day 5 of culture. The expression levels of the genes studied were normalized to the TBP levels in each sample. The values represent means ± S.E. of four independent experiments, each performed in duplicate. Expression levels in the untreated white adipocyte cultures were set in each experiment to the mean of its normalized values, and the levels in other white and brown adipocytes were expressed relative to this value in each individual experiment. Statistical analysis is as in Fig. 3. *, p < 0.05; **, p < 0.01; ***, p < 0.001.
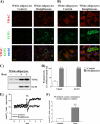
FIGURE 6.
Only a subset of cells in rosiglitazone-treated white adipocyte cultures is UCP1-positive and demonstrates NE-induced UCP1-dependent thermogenesis. Primary cultures of white and brown adipocytes were grown for 7 (A–D) or 6 (E and F) days in the absence or presence of 1 μ
m
rosiglitazone. A and B, cells were analyzed by immunofluorescence cell staining using antibodies against VDAC (red) and UCP1 (green). Nuclei were counterstained with Hoechst 33258 (blue). Cells were examined with a fluorescence microscope, and representative images are presented (lower (A) and higher (B) magnification). (A version of A and B, with an altered background, is found in
supplemental Fig. 5
.) C and D, protein levels of VDAC and UCP1 in control and rosiglitazone-treated white adipocyte cultures. C, representative Western blots. Total cell lysates (30 μg of protein/lane) were examined using antibodies against VDAC and UCP1. D, VDAC and UCP1 protein levels in control and rosiglitazone-treated white adipocyte cultures. The values represent means ± S.E. of four independent experiments, each performed in duplicate. The rosiglitazone-induced level was in each experiment set to 100%, and the levels in untreated cells were expressed relative to this value in each individual experiment. The significance of rosiglitazone treatment was determined with paired t test. **, p < 0.01; ***, p < 0.001. E, representative traces showing the effect of NE on oxygen consumption of control (thin line) and rosiglitazone-treated (thick line) white adipocyte cultures. At the arrow, 1 μ
m
NE was added. F, NE-induced component of respiration (calculated as the difference between the rates of oxygen consumption before and after addition of NE) in control and rosiglitazone-treated white adipocyte cultures. The polarographic output was time-differentiated, sampled, and recalculated per milligram of total cellular protein. The values are means ± S.E. of four independent experiments. The significance of rosiglitazone treatment was determined with paired t test. **, p < 0.01.
FIGURE 7.
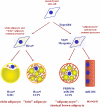
Subtypes of adipocytes and their origins. This study, together with earlier studies, particularly Refs , , , implies that (at least) three types of adipocytes should be distinguished: the classic brown adipocytes (the adipomyocytes), the brite adipocytes (i.e. the brown adipocyte-like adipocytes induced in white adipocyte cultures), and the genuine white adipocytes. The adipomyocytes share their origin with myocytes, whereas brite and white adipocytes have a different origin.
Similar articles
- Thermogenically competent nonadrenergic recruitment in brown preadipocytes by a PPARgamma agonist.
Petrovic N, Shabalina IG, Timmons JA, Cannon B, Nedergaard J. Petrovic N, et al. Am J Physiol Endocrinol Metab. 2008 Aug;295(2):E287-96. doi: 10.1152/ajpendo.00035.2008. Epub 2008 May 20. Am J Physiol Endocrinol Metab. 2008. PMID: 18492776 - The PPARγ agonist rosiglitazone promotes the induction of brite adipocytes, increasing β-adrenoceptor-mediated mitochondrial function and glucose uptake.
Merlin J, Sato M, Nowell C, Pakzad M, Fahey R, Gao J, Dehvari N, Summers RJ, Bengtsson T, Evans BA, Hutchinson DS. Merlin J, et al. Cell Signal. 2018 Jan;42:54-66. doi: 10.1016/j.cellsig.2017.09.023. Epub 2017 Sep 29. Cell Signal. 2018. PMID: 28970184 - An essential role for Tbx15 in the differentiation of brown and "brite" but not white adipocytes.
Gburcik V, Cawthorn WP, Nedergaard J, Timmons JA, Cannon B. Gburcik V, et al. Am J Physiol Endocrinol Metab. 2012 Oct 15;303(8):E1053-60. doi: 10.1152/ajpendo.00104.2012. Epub 2012 Aug 21. Am J Physiol Endocrinol Metab. 2012. PMID: 22912368 - Brown fat biology and thermogenesis.
Richard D, Picard F. Richard D, et al. Front Biosci (Landmark Ed). 2011 Jan 1;16(4):1233-60. doi: 10.2741/3786. Front Biosci (Landmark Ed). 2011. PMID: 21196229 Review. - Manipulating molecular switches in brown adipocytes and their precursors: a therapeutic potential.
Birerdinc A, Jarrar M, Stotish T, Randhawa M, Baranova A. Birerdinc A, et al. Prog Lipid Res. 2013 Jan;52(1):51-61. doi: 10.1016/j.plipres.2012.08.001. Epub 2012 Aug 30. Prog Lipid Res. 2013. PMID: 22960032 Review.
Cited by
- The Effect of Irisin as a Metabolic Regulator and Its Therapeutic Potential for Obesity.
Li H, Wang F, Yang M, Sun J, Zhao Y, Tang D. Li H, et al. Int J Endocrinol. 2021 Mar 18;2021:6572342. doi: 10.1155/2021/6572342. eCollection 2021. Int J Endocrinol. 2021. PMID: 33790964 Free PMC article. Review. - Ckmt1 is Dispensable for Mitochondrial Bioenergetics Within White/Beige Adipose Tissue.
Politis-Barber V, Petrick HL, Raajendiran A, DesOrmeaux GJ, Brunetta HS, Dos Reis LM, Mori MA, Wright DC, Watt MJ, Holloway GP. Politis-Barber V, et al. Function (Oxf). 2022 Jul 19;3(5):zqac037. doi: 10.1093/function/zqac037. eCollection 2022. Function (Oxf). 2022. PMID: 37954502 Free PMC article. - How brown is brown fat? It depends where you look.
Nedergaard J, Cannon B. Nedergaard J, et al. Nat Med. 2013 May;19(5):540-1. doi: 10.1038/nm.3187. Nat Med. 2013. PMID: 23652104 No abstract available. - Neural control of white, beige and brown adipocytes.
Bartness TJ, Ryu V. Bartness TJ, et al. Int J Obes Suppl. 2015 Aug;5(Suppl 1):S35-9. doi: 10.1038/ijosup.2015.9. Epub 2015 Aug 4. Int J Obes Suppl. 2015. PMID: 27152173 Free PMC article. Review. - Human mediastinal adipose tissue displays certain characteristics of brown fat.
Cheung L, Gertow J, Werngren O, Folkersen L, Petrovic N, Nedergaard J, Franco-Cereceda A, Eriksson P, Fisher RM. Cheung L, et al. Nutr Diabetes. 2013 May 13;3(5):e66. doi: 10.1038/nutd.2013.6. Nutr Diabetes. 2013. PMID: 23670224 Free PMC article.
References
- Atit R., Sgaier S. K., Mohamed O. A., Taketo M. M., Dufort D., Joyner A. L., Niswander L., Conlon R. A. (2006) Dev. Biol. 296, 164–176 - PubMed
- Walden T. B., Timmons J. A., Keller P., Nedergaard J., Cannon B. (2009) J. Cell Physiol. 218, 444–449 - PubMed
- Cannon B., Nedergaard J. (2008) Nature 454, 947–948 - PubMed
Publication types
MeSH terms
Substances
LinkOut - more resources
Full Text Sources
Other Literature Sources
