ERG is required for the differentiation of embryonic stem cells along the endothelial lineage - PubMed (original) (raw)
ERG is required for the differentiation of embryonic stem cells along the endothelial lineage
Vesna Nikolova-Krstevski et al. BMC Dev Biol. 2009.
Abstract
Background: The molecular mechanisms that govern stem cell differentiation along the endothelial lineage remain largely unknown. Ets related gene (ERG) has recently been shown to participate in the transcriptional regulation of a number of endothelial specific genes including VE-cadherin (CD144), endoglin, and von Willebrand's Factor (vWF). The specific role of the ETS factor ERG during endothelial differentiation has not been evaluated.
Results: ERG expression and function were evaluated during the differentiation of embryonic stem cells into embryoid bodies (EB). The results of our study demonstrate that ERG is first expressed in a subpopulation of vascular endothelial growth factor receptor 2 (VEGF-R2) expressing cells that also express VE-cadherin. During ES cell differentiation, ERG expression remains restricted to cells of the endothelial lineage that eventually coalesce into primitive vascular structures within embryoid bodies. ERG also exhibits an endothelial cell (EC)-restricted pattern during embryogenesis. To further define the role of ERG during ES cell differentiation, we used a knockdown strategy to inhibit ERG expression. Delivery of three independent shRNA led to 70-85% reductions in ERG expression during ES cell differentiation compared to no change with control shRNA. ERG knockdown was associated with a marked reduction in the number of ECs, the expression of EC-restricted genes, and the formation of vascular structures.
Conclusion: The ETS factor ERG appears to be a critical regulator of EC differentiation.
Figures
Figure 1
ERG expression in differentiating EBs is endothelial-cell specific. (A) Quantitative RT-PCR of RNA derived from EBs at different stages of differentiation (days 0-10), showing temporal correlation in the expression of ERG (blue) and endothelial-specific VE-cadherin (purple). Copy numbers (normalized per 10,000 copies GAPDH) are shown for VE-cadherin (left) and ERG (right) Y-axis. (n = 3) (B) ERG expression in sorted cell populations. Q-RT-PCR analysis of RNA isolated from EB cells sorted for VEGF-R2 at day 3.5, and VE-cadherin and CD41 at day 4.5 are shown. ERG is present in the mesodermal/hemangioblast cells expressing VEGF-R2 at day 3.5. ERG is highly enriched in the VE-cadherin expression population, but is almost absent in the CD41+ cells at day 4.5. Error bars indicate means +/- S.D. (n = 3)(C) Flow cytometry analysis of ERG expression in EBs at different time points of ES cell differentiation. The increasing percentage of cells expressing ERG over time is shown by the shifting cell population (green) along the x-axis, compared to the ERG negative cells, shown in red. (D) Flow cytometry analysis of ERG expression in relation to other cell-lineage specific markers: hematopoietic (CD41 and Ter119), and endothelial (VE-cadherin) in day 8.5 EBs. Cell population expressing ERG was labeled with green fluorescent marker (FITC) and migrated along the x-axis.
Figure 2
Temporal and spatial ERG expression pattern in differentiating ES cells. (A) Fluorescence immunostaining of frozen EB sections with rabbit anti-ERG and Alexa 498 anti-rabbit IgG (green) at the early stages of EB differentiation. ERG is first detected in the developing EBs at day 3. (B) Double immunostaining of frozen EB sections with ERG Ab (green) and VE-cadherin Ab (red) shows consistent co-localization of the two markers during the time-course of EB differentiation. DAPI nuclear staining (shown in blue) provides an outline of the general EB morphology. (C) Fluorescence immunostaining of frozen EB sections with anti-ERG Ab (green) at later stages of EB differentiation (days 6, 8, and 10) demonstrates ERG expression and organization in more complex vascular structures lining the walls of the vascular channels. (D) Co-expression of ERG (green) and VE-cadherin (red) in the vascular channels of day 10 EB. DAPI nuclear staining (blue) provides an outline of the general EB morphology. The images were obtained with Leica fluorescence microscope at 40× magnification. Scale bar represents 200 μm.
Figure 3
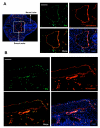
ERG and VE-cadherin expression in E9.5 and E12.5 embryos. **(A)**Transverse section of an E9.5 embryo (left). Right hand 4-part panel demonstrates ERG expression (green), VE-cadherin (red); overlap of ERG and VE-cadherin (lower left) and with DAPI staining (lower right). (B) Evaluation of ERG (green) and VE-cadherin (red) expression in sagittal sections of the dorsal aorta (E12.5) of the mouse embryo. Co-localization of ERG and VE-cadherin are shown in the lower left hand panel, and with DAPI nuclear staining (bottom right panel). The images were obtained with Leica fluorescence microscope at 10× and 40× magnification. Scale bars: 70 μm (A) and 40 μm (B).
Figure 4
Evaluation of ERG expression in the developing heart. Sagittal sections of E9.5 mouse embryos with DAPI staining (left upper panel). High power magnification of the developing cardiac ventricular chamber (upper right) and common atrial chamber. The ventricular chamber is highly trabeculated and expression of the endocardial surface is shown by VE-cadherin staining (red). ERG (green) co-localizes with VE-cadherin expressing cells in both the atrium and ventricular chambers. The images were obtained with Leica fluorescence microscope at 10× and 40× magnification. Scale bars represent 80 μm and 70 μm (top and bottom panel, respectively).
Figure 5
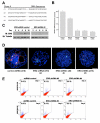
ERG knockdown in ERG shRNA treated EB. (A) Four different ERG shRNA sequences were used for transduction and expression in ES cells prior to EB differentiation. A scrambled nucleotide sequence was used as a control. (B) Evaluation of ERG expression by Q-RT-PCR in EBs at day 8 using lentivirally delivered control, and ERG shRNAs (lentivirally delivered sequences #1-4 were used to generate ERGshRNA ES cell clones #1-4 respectively). Expression levels are shown as a percentage of control shRNA treated cells Error bars indicate means +/- S.D. (n = 4). (C) Evaluation of ERG expression in differentiating control and ERG shRNA treated ES cells by Western blot analysis. (D) Immunohistochemical analysis of ERG (green), VE-cadherin (red), and nuclear staining DAPI (blue) in EBs from control and ERG shRNA clones # 3 and 4 at day 10 and day 8 (# 3) The images were obtained using Leica fluorescence microscope at 40× magnification. Scale bar represents 100 μm. (E). Evaluation of VEGF-R2 expression in ERG shRNA (#3 and #4), or control shRNA treated ES cells by flow cytometry at 3 and 6 days after differentiation.
Figure 6
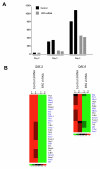
ERG target genes in VEGF-R2+ ES cells. (A) Normalized microarray expression values for ERG in VEGF-R2+ cells sorted from ERG shRNA or control cells 2, 3, and 4 days after differentiation. (B) Heat map of a subset of genes that are significantly differentially downregulated after 3 days and 4 days in ERG shRNA versus control ES cells. In the heatmaps, rows represent genes and columns represent samples, ordered as control and shRNA treated. Genes are clustered using row-normalized signal values which are mapped to the [-1,1] interval. Transcription factors are shown in blue. All other genes are shown in black. Signal values are color-coded so that red and green represent high and low expression values, respectively.
Similar articles
- Gene expression analysis of embryonic stem cells expressing VE-cadherin (CD144) during endothelial differentiation.
Nikolova-Krstevski V, Bhasin M, Otu HH, Libermann T, Oettgen P. Nikolova-Krstevski V, et al. BMC Genomics. 2008 May 22;9:240. doi: 10.1186/1471-2164-9-240. BMC Genomics. 2008. PMID: 18498633 Free PMC article. - Antiinflammatory effects of the ETS factor ERG in endothelial cells are mediated through transcriptional repression of the interleukin-8 gene.
Yuan L, Nikolova-Krstevski V, Zhan Y, Kondo M, Bhasin M, Varghese L, Yano K, Carman CV, Aird WC, Oettgen P. Yuan L, et al. Circ Res. 2009 May 8;104(9):1049-57. doi: 10.1161/CIRCRESAHA.108.190751. Epub 2009 Apr 9. Circ Res. 2009. PMID: 19359602 Free PMC article. - Endothelial Erg expression is required for embryogenesis and vascular integrity.
Han R, Pacifici M, Iwamoto M, Trojanowska M. Han R, et al. Organogenesis. 2015;11(2):75-86. doi: 10.1080/15476278.2015.1031435. Organogenesis. 2015. PMID: 26061019 Free PMC article. - Regulation of endothelial homeostasis, vascular development and angiogenesis by the transcription factor ERG.
Shah AV, Birdsey GM, Randi AM. Shah AV, et al. Vascul Pharmacol. 2016 Nov;86:3-13. doi: 10.1016/j.vph.2016.05.003. Epub 2016 May 18. Vascul Pharmacol. 2016. PMID: 27208692 Free PMC article. Review. - The ETS Factor, ETV2: a Master Regulator for Vascular Endothelial Cell Development.
Oh SY, Kim JY, Park C. Oh SY, et al. Mol Cells. 2015 Dec;38(12):1029-36. doi: 10.14348/molcells.2015.0331. Epub 2015 Dec 21. Mol Cells. 2015. PMID: 26694034 Free PMC article. Review.
Cited by
- Universal method for the isolation of microvessels from frozen brain tissue: A proof-of-concept multiomic investigation of the neurovasculature.
Wakid M, Almeida D, Aouabed Z, Rahimian R, Davoli MA, Yerko V, Leonova-Erko E, Richard V, Zahedi R, Borchers C, Turecki G, Mechawar N. Wakid M, et al. Brain Behav Immun Health. 2023 Sep 21;34:100684. doi: 10.1016/j.bbih.2023.100684. eCollection 2023 Dec. Brain Behav Immun Health. 2023. PMID: 37822873 Free PMC article. - GATA3-induced vWF upregulation in the lung adenocarcinoma vasculature.
Xu Y, Pan S, Liu J, Dong F, Cheng Z, Zhang J, Qi R, Zang Q, Zhang C, Wang X, Zhang J, Wang F, Allen TD, Liu J. Xu Y, et al. Oncotarget. 2017 Nov 30;8(66):110517-110529. doi: 10.18632/oncotarget.22806. eCollection 2017 Dec 15. Oncotarget. 2017. PMID: 29299165 Free PMC article. - Single Cell Resolution of Human Hematoendothelial Cells Defines Transcriptional Signatures of Hemogenic Endothelium.
Angelos MG, Abrahante JE, Blum RH, Kaufman DS. Angelos MG, et al. Stem Cells. 2018 Feb;36(2):206-217. doi: 10.1002/stem.2739. Epub 2017 Dec 13. Stem Cells. 2018. PMID: 29139170 Free PMC article. - Slit2-Robo Signaling Promotes Glomerular Vascularization and Nephron Development.
Li J, Geraldo LH, Dubrac A, Zarkada G, Eichmann A. Li J, et al. J Am Soc Nephrol. 2021 Sep;32(9):2255-2272. doi: 10.1681/ASN.2020111640. Epub 2021 Aug 2. J Am Soc Nephrol. 2021. PMID: 34341180 Free PMC article. - Disruption of maternal vascular remodeling by a fetal endoretrovirus-derived gene in preeclampsia.
Gong X, He W, Jin W, Ma H, Wang G, Li J, Xiao Y, Zhao Y, Chen Q, Guo H, Yang J, Qi Y, Dong W, Fu M, Li X, Liu J, Liu X, Yin A, Zhang Y, Wei Y. Gong X, et al. Genome Biol. 2024 May 7;25(1):117. doi: 10.1186/s13059-024-03265-z. Genome Biol. 2024. PMID: 38715110 Free PMC article.
References
- Drake CJ, Fleming PA. Vasculogenesis in the day 6.5 to 9.5 mouse embryo. Blood. 2000;95:1671–9. - PubMed
- Choi K, Kennedy M, Kazarov A, Papadimitriou JC, Keller G. A common precursor for hematopoietic and endothelial cells. Development. 1998;125:725–32. - PubMed
Publication types
MeSH terms
Substances
LinkOut - more resources
Full Text Sources
Other Literature Sources
Molecular Biology Databases
Miscellaneous


