Electron transport chain-dependent and -independent mechanisms of mitochondrial H2O2 emission during long-chain fatty acid oxidation - PubMed (original) (raw)
Electron transport chain-dependent and -independent mechanisms of mitochondrial H2O2 emission during long-chain fatty acid oxidation
Erin L Seifert et al. J Biol Chem. 2010.
Abstract
Oxidative stress in skeletal muscle is a hallmark of various pathophysiologic states that also feature increased reliance on long-chain fatty acid (LCFA) substrate, such as insulin resistance and exercise. However, little is known about the mechanistic basis of the LCFA-induced reactive oxygen species (ROS) burden in intact mitochondria, and elucidation of this mechanistic basis was the goal of this study. Specific aims were to determine the extent to which LCFA catabolism is associated with ROS production and to gain mechanistic insights into the associated ROS production. Because intermediates and by-products of LCFA catabolism may interfere with antioxidant mechanisms, we predicted that ROS formation during LCFA catabolism reflects a complex process involving multiple sites of ROS production as well as modified mitochondrial function. Thus, we utilized several complementary approaches to probe the underlying mechanism(s). Using skeletal muscle mitochondria, our findings indicate that even a low supply of LCFA is associated with ROS formation in excess of that generated by NADH-linked substrates. Moreover, ROS production was evident across the physiologic range of membrane potential and was relatively insensitive to membrane potential changes. Determinations of topology and membrane potential as well as use of inhibitors revealed complex III and the electron transfer flavoprotein (ETF) and ETF-oxidoreductase, as likely sites of ROS production. Finally, ROS production was sensitive to matrix levels of LCFA catabolic intermediates, indicating that mitochondrial export of LCFA catabolic intermediates can play a role in determining ROS levels.
Figures
FIGURE 1.
Mitochondrial fatty acid handling and possible mechanisms of ROS generation during fatty acid oxidation. LCFA are activated on the mitochondrial outer membrane (MOM) to acyl-CoA and then taken up into mitochondria by the carnitine palmitoyltransferase (CPT) system, with conversion to acylcarnitine and then back to acyl-CoA. Electrons enter the ETC via β-oxidation and the tricarboxylic acid cycle (TCA) or via the ETF and ETF-QO. Possible sites of electron leakage and ROS formation are at complex I (at the flavin site or at the quinone binding site via RET) (13, 44, 54), at complex III (13, 51, 53), and from the ETF and ETF-QO (18). ROS generated at complex III can diffuse into the matrix and the intermembrane space (13, 51). If acyl-CoA supply exceeds the downstream catabolic capacity, acyl-CoA esters can be converted to acylcarnitines via carnitine acyltransferase (CrAT; with specificity for acetyl-CoA and short-chain acyl-CoA) and then exported from mitochondria via carnitine acylcarnitine transferase (CACT) (62).
l
-Carnitine supplementation increases acylcarnitine export (55–57). Because acyl-CoA esters can inhibit matrix ROS mitigating or detoxifying enzymes (22–25), acylcarnitine export may lower ROS during FAO. Rotenone (Rot) inhibits complex I. Antimycin A (Anti) binds cytochrome b to prevent electron flow to the ubiquinone binding site of complex III. Oligomycin (Oligo) inhibits the ATP synthase. MIM, mitochondrial inner membrane.
FIGURE 2.
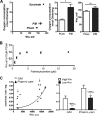
H2O2 emission rate as a function of substrate concentration and type in skeletal muscle mitochondria. A, H2O2 emission rate with increasing supply of PCarn. Values are means ± S.E., n = 5 (n = 2 for 36 μ
m
PCarn). *, **, and ***, p < 0.05, p < 0.01, and p < 0.001, respectively, significantly different from adjacent lower concentration; one-way analysis of variance (repeated measures), Bonferroni post-tests; analysis excludes 36 μ
m
palmitoylcarnitine. B, raw fluorescence signals showing H2O2 emission with 18 μ
m
palmitoylcarnitine but not with a saturating concentration of NADH-linked substrate (pyruvate/malate, 10/5 m
m
; glutamate/malate, 10/5 m
m
). H2O2 emission is indicated by an increase in the fluorescence signal. Inset, quantification (nmol H2O2/min/mg). Open bar, pyruvate/malate; closed bar, PCarn. Values are means ± S.E. (n = 5).
FIGURE 3.
Low energization of skeletal muscle mitochondria supplied with long-chain fatty acid substrate and relative insensitivity of H2O2 to Ψm. A, parallel determinations of Ψm and O2 consumption in mitochondria respiring on 18 μ
m
PCarn, 10/5 m
m
P/M, or 9 m
m
succinate (n = 2–5). Membrane potential was measured using a TPMP+-selective electrode. Bar graphs, statistical comparisons between PCarn and P/M. * and **, p < 0.03 and p < 0.01, respectively, paired t test. Values are means ± S.E. B, Ψm determinations by safranin fluorescence. Values are means ± S.E., expressed as a fraction of the 18 μ
m
PCarn value (n = 3). C, Ψm and H2O2 emission rate in skeletal muscle mitochondria supplied with 18 μ
m
PCarn or G/M (10/5 m
m
). FCCP was used to titrate the membrane potential (PCarn, 15 p
m
FCCP; G/M, 100 p
m
FCCP). Curve in C, the Ψm-H2O2 relationship with G/M was fit using the equation, y = 0.06267_e_0.000183_x_ (_R_2 = 0.988). Arrows in C, values used for quantification in bar graphs. Bar graphs, average H2O2 emission rates at Ψm indicated by the arrows in C (n = 4). * and ***, p < 0.05 or p < 0.005, respectively, paired t test, low versus high Ψm. Values are means ± S.E. Numbers above bars summarize the approximate percentage decrease in H2O2 emission rate when going from lower to higher membrane potential.
FIGURE 4.
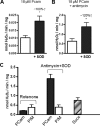
Topology and sites of ROS production in skeletal muscle mitochondria oxidizing long-chain fatty acid substrate. A, H2O2 emission rate of mitochondria oxidizing 18 μ
m
PCarn in the absence or presence of added Cu/Zn-SOD (200 units/ml). B, as in A, with the addition of antimycin A (1 μ
m
) to inhibit complex III. In A and B, the approximate percentage decrease increase in H2O2 emission rate with SOD addition is given. Increased H2O2 emission upon SOD addition indicates release of superoxide toward the intermembrane space. C, comparison of H2O2 emission rates in mitochondria supplied with PCarn (18 μ
m
) or P/M (10/5 m
m
), in the presence of rotenone (1 μ
m
) to inhibit complex I or antimycin plus SOD. The H2O2 emission rate was evaluated with a supply of succinate alone, which generates ROS by reverse electron transport to complex I. All values are means ± S.E. (n = 3–5). *, p < 0.03, paired t test, without SOD versus with SOD.
FIGURE 5.
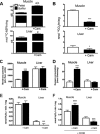
l-Carnitine effects on bioenergetics and H2O2 emission rates of skeletal muscle and liver mitochondria.
l
-Carnitine (2 m
m
; Carn) was utilized to decrease levels of long-chain fatty acid catabolic intermediates within the mitochondrial matrix. Mitochondria (0.2 mg/ml) were supplied with 18 μ
m
PCarn. A, in mitochondria supplied with PCarn plus [1-14C]palmitoylcarnitine, the [14C]acid-soluble product (14C-ASP) was used as a measure of LCFA catabolic intermediate levels within the matrix (pellet) and effluxed from mitochondria into the buffer (buffer). Above the bar in the muscle panel, a and b, p < 0.003 and p < 0.015 for buffer and pellet fractions, respectively, paired t test, without
l
-carnitine versus with
l
-carnitine. Above the bar in the liver panel, #, p = 0.08, paired t test, [14C]ASP was increased in the buffer fraction in four of four preparations. B, rate of 14CO2 production. C–F, bioenergetic parameters (C and D) and H2O2 emission rates (E and F) were determined under the same conditions as in A and B, using only cold PCarn. In F, CDNB was used to deplete mitochondria of reduced glutathione. A–D, n = 4; E and F, n = 7–8. In all panels, values are means ± S.E. * and ***, p < 0.05 and p < 0.005, respectively, paired t test.
FIGURE 6.
Impact of NNT deletion on carnitine effects on H2O2 emission in skeletal mitochondria from C57Bl/6J and C57Bl/6 mice. Mitochondria were supplied with 18 μ
m
palmitoylcarnitine. A, H2O2 emission rates. B, Ψm. C57Bl6/J mice harbor a five-exon deletion in the Nnt gene (see
supplemental Fig. 5
). Nnt encodes for NNT, which is thought to be largely responsible for NAD(P)H regeneration in mitochondria and thus to contribute to the maintenance of glutathione antioxidant defense. Values are means ± S.E., n = 3. ** and ***, p < 0.03 and p < 0.01, respectively, without carnitine versus with carnitine, two-way analysis of variance with Bonferroni post hoc tests.
Similar articles
- Chronic Hypoxia Enhances β-Oxidation-Dependent Electron Transport via Electron Transferring Flavoproteins.
Fuhrmann DC, Olesch C, Kurrle N, Schnütgen F, Zukunft S, Fleming I, Brüne B. Fuhrmann DC, et al. Cells. 2019 Feb 18;8(2):172. doi: 10.3390/cells8020172. Cells. 2019. PMID: 30781698 Free PMC article. - Structure of electron transfer flavoprotein-ubiquinone oxidoreductase and electron transfer to the mitochondrial ubiquinone pool.
Zhang J, Frerman FE, Kim JJ. Zhang J, et al. Proc Natl Acad Sci U S A. 2006 Oct 31;103(44):16212-7. doi: 10.1073/pnas.0604567103. Epub 2006 Oct 18. Proc Natl Acad Sci U S A. 2006. PMID: 17050691 Free PMC article. - The critical role of Arabidopsis electron-transfer flavoprotein:ubiquinone oxidoreductase during dark-induced starvation.
Ishizaki K, Larson TR, Schauer N, Fernie AR, Graham IA, Leaver CJ. Ishizaki K, et al. Plant Cell. 2005 Sep;17(9):2587-600. doi: 10.1105/tpc.105.035162. Epub 2005 Jul 29. Plant Cell. 2005. PMID: 16055629 Free PMC article. - Contribution of FAT/CD36 to the regulation of skeletal muscle fatty acid oxidation: an overview.
Holloway GP, Luiken JJ, Glatz JF, Spriet LL, Bonen A. Holloway GP, et al. Acta Physiol (Oxf). 2008 Dec;194(4):293-309. doi: 10.1111/j.1748-1716.2008.01878.x. Epub 2008 Jul 9. Acta Physiol (Oxf). 2008. PMID: 18510711 Review. - The electron transfer flavoprotein: ubiquinone oxidoreductases.
Watmough NJ, Frerman FE. Watmough NJ, et al. Biochim Biophys Acta. 2010 Dec;1797(12):1910-6. doi: 10.1016/j.bbabio.2010.10.007. Epub 2010 Oct 16. Biochim Biophys Acta. 2010. PMID: 20937244 Review.
Cited by
- Mitochondrial fatty acid oxidation drives senescence.
Yamauchi S, Sugiura Y, Yamaguchi J, Zhou X, Takenaka S, Odawara T, Fukaya S, Fujisawa T, Naguro I, Uchiyama Y, Takahashi A, Ichijo H. Yamauchi S, et al. Sci Adv. 2024 Oct 25;10(43):eado5887. doi: 10.1126/sciadv.ado5887. Epub 2024 Oct 25. Sci Adv. 2024. PMID: 39454000 Free PMC article. - In adipose tissue, increased mitochondrial emission of reactive oxygen species is important for short-term high-fat diet-induced insulin resistance in mice.
Paglialunga S, Ludzki A, Root-McCaig J, Holloway GP. Paglialunga S, et al. Diabetologia. 2015 May;58(5):1071-80. doi: 10.1007/s00125-015-3531-x. Epub 2015 Mar 11. Diabetologia. 2015. PMID: 25754553 - Monocyte metabolic transcriptional programs associate with resistance to tuberculin skin test/interferon-γ release assay conversion.
Simmons JD, Van PT, Stein CM, Chihota V, Ntshiqa T, Maenetje P, Peterson GJ, Reynolds A, Benchek P, Velen K, Fielding KL, Grant AD, Graustein AD, Nguyen FK, Seshadri C, Gottardo R, Mayanja-Kizza H, Wallis RS, Churchyard G, Boom WH, Hawn TR. Simmons JD, et al. J Clin Invest. 2021 Jul 15;131(14):e140073. doi: 10.1172/JCI140073. J Clin Invest. 2021. PMID: 34111032 Free PMC article. Clinical Trial. - Mitochondrial physiology in the major arbovirus vector Aedes aegypti: substrate preferences and sexual differences define respiratory capacity and superoxide production.
Soares JB, Gaviraghi A, Oliveira MF. Soares JB, et al. PLoS One. 2015 Mar 24;10(3):e0120600. doi: 10.1371/journal.pone.0120600. eCollection 2015. PLoS One. 2015. PMID: 25803027 Free PMC article. - Mechanism of Obesity-Related Lipotoxicity and Clinical Perspective.
Engin AB. Engin AB. Adv Exp Med Biol. 2024;1460:131-166. doi: 10.1007/978-3-031-63657-8_5. Adv Exp Med Biol. 2024. PMID: 39287851 Review.
References
- Hansford R. G., Hogue B. A., Mildaziene V. (1997) J. Bioenerg. Biomembr. 29, 89–95 - PubMed
- Chance B., Sies H., Boveris A. (1979) Physiol. Rev. 59, 527–605 - PubMed
- Abdul-Ghani M. A., Jani R., Chavez A., Molina-Carrion M., Tripathy D., Defronzo R. A. (2009) Diabetologia 52, 574–582 - PubMed
Publication types
MeSH terms
Substances
LinkOut - more resources
Full Text Sources


