Reprogramming of 3' untranslated regions of mRNAs by alternative polyadenylation in generation of pluripotent stem cells from different cell types - PubMed (original) (raw)
Reprogramming of 3' untranslated regions of mRNAs by alternative polyadenylation in generation of pluripotent stem cells from different cell types
Zhe Ji et al. PLoS One. 2009.
Abstract
Background: The 3' untranslated regions (3'UTRs) of mRNAs contain cis elements involved in post-transcriptional regulation of gene expression. Over half of all mammalian genes contain multiple polyadenylation sites that lead to different 3'UTRs for a gene. Studies have shown that the alternative polyadenylation (APA) pattern varies across tissues, and is dynamically regulated in proliferating or differentiating cells. Generation of induced pluripotent stem (iPS) cells, in which differentiated cells are reprogrammed to an embryonic stem (ES) cell-like state, has been intensively studied in recent years. However, it is not known how 3'UTRs are regulated during cell reprogramming.
Methods/main findings: Using a computational method that robustly examines APA across DNA microarray data sets, we analyzed 3'UTR dynamics in generation of iPS cells from different cell types. We found that 3'UTRs shorten during reprogramming of somatic cells, the extent of which depends on the type of source cell. By contrast, reprogramming of spermatogonial cells involves 3'UTR lengthening. The alternative polyadenylation sites that are highly responsive to change of cell state in generation of iPS cells are also highly regulated during embryonic development in opposite directions. Compared with other sites, they are more conserved, can lead to longer alternative 3'UTRs, and are associated with more cis elements for polyadenylation. Consistently, reprogramming of somatic cells and germ cells involves significant upregulation and downregulation, respectively, of mRNAs encoding polyadenylation factors, and RNA processing is one of the most significantly regulated biological processes during cell reprogramming. Furthermore, genes containing target sites of ES cell-specific microRNAs (miRNAs) in different portions of 3'UTR are distinctively regulated during cell reprogramming, suggesting impact of APA on miRNA targeting.
Conclusions/significance: Taken together, these findings indicate that reprogramming of 3'UTRs by APA, which result from regulation of both general polyadenylation activity and cell type-specific factors and can reset post-transcriptional gene regulatory programs in the cell, is an integral part of iPS cell generation, and the APA pattern can be a good biomarker for cell type and state, useful for sample classification. The results also suggest that perturbation of the mRNA polyadenylation machinery or RNA processing activity may facilitate generation of iPS cells.
Conflict of interest statement
Competing Interests: The authors have declared that no competing interests exist.
Figures
Figure 1. Schematic of APA and analysis of APA using Affymetrix GeneChip probes.
(A) A hypothetical gene with 2 poly(A) sites in the 3′-most exon expresses 2 transcript isoforms with different 3′UTRs. The common region is named constitutive UTR (cUTR) and the alternative region alternative UTR (aUTR). The poly(A) sites are named proximal and distal poly(A) sites based on their locations relative to the coding sequence (CDS). Affymetrix (Affy) GeneChip probes targeting cUTRs and aUTRs are separated and compared to derive a Relative Usage of Distal poly(A) site (RUD) score. pA, poly(A) site; AAA, poly(A) tail. (B) A gene with a single poly(A) site expresses a transcript with a single 3′UTR, named sUTR. Affy probes targeting sUTRs were randomly selected, 2 probes from 5′ region and 2 from 3′ region, for normalizing RUD values (see Figure S1 for detail).
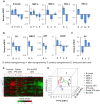
Figure 2. Dynamic regulation of 3′UTR in generation of iPS cells.
(A) Mouse cells reprogrammed to iPS cells. Each study is named by its source cell, which is indicated in the graph and listed in Table S1. B lymph., B lymphocyte; MEF, mouse embryonic fibroblast; NSC, neural stem cell. The y-axis for each plot is normalized Relative Usage of Distal poly(A) site score for a sample (nRUD, see Figure S1 for detail). Error bars are standard deviations based on multiple samples. As indicated in the graphs, cells before and after reprogramming are indicated by ‘B’ and ‘A’, respectively, and partially reprogrammed cells and embryonic stem cells (ESCs) are indicated by ‘P’ and ‘E’, respectively. For the B lymph. data set, P1 and P2 corresponds to BIV1 (+Dox) and BIV1 (−Dox) in , respectively. (B) Human cells reprogrammed to iPS cells. Data are presented as in (A). All cells were derived from fibroblasts (see Table S1 for details). (C) Generation of iPS cells from human spermatogonial cells (SCs). Data are presented as in (A). (D) Hierarchical clustering of samples and gene nRUD values. Detailed view of the sample cluster and sample names are shown in Figure S7. A total of 674 genes were used. Clustering was based on Pearson Correlation. (E) Principal component (PC) analysis of samples using gene nRUD values. The top 3 PCs are plotted. As shown in the graph, symbols indicate cell types and colors indicate cell states. The percent of variation accounted for by each PC is indicated in parentheses. For all data sets, nRUD values before reprogramming are significantly different than those after reprogramming (P<0.05, T-test, see Table S1 for list of _P_-values).
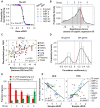
Figure 3. The 3′UTR regulation in generation of iPS cells is related to that in embryonic development.
(A) An example of 3′UTR regulation in generation of mouse iPS cells. The gene Tbc1d1 was randomly selected. The relationship between reprogramming state, i.e. before and after reprogramming, and gene nRUD values from 6 different data sets for 3 different cell types was analyzed by logistic regression. Y-axis is predicted probability that a sample is iPS cell after fitting the logistic regression model. _P_-value for data fitting is shown in the graph. (B) Distribution of logistic regression significance score (SS) for all surveyed genes (674 in total) (See Methods for detail). As indicated on top of the graph, genes with negative SS were evenly divided into 3 groups and those with positive SS were divided into 2 groups. (C) An example of gene (Eif1ad) with 3′UTR lengthening in embryonic development. X-axis is relative embryonic days, with 0 being the median time point for each sample set. Y-axis is standardized RUD values which makes different sample sets comparable. Pearson correlation (r) and _P_-value for the linear regression line are shown in the graph, which reflect change of 3′UTR length over developmental time. (D) A total of 606 genes with APA that had detectable signals in more than 50% of all samples between 8.5 and P0 were surveyed, and 284 genes had significant change of 3′UTR over time (P<0.05). A histogram of correlation (r) for these genes is presented. (E) Comparison of 3′UTR regulation in generation of iPS cells and embryonic development. Genes with significant regulation of 3′UTRs by APA in embryonic development were shown in (D). Fractions of genes with lengthening (red) or shortening (green) 3′UTRs during embryonic development for each of the 5 groups derived from (B) are plotted. _P_-value (Chi-squared test comparing fractions of genes with 3′UTR lengthening in embryonic development in 5 groups with those with 3′UTR shortening) = 8.5×10⁻¹¹. (F) Correlation between nRUD values in generation of iPS cells and mRNA expression of the genes that are negatively (left) and positively (right) correlated with 3′UTR length in embryonic development. These gene sets are called negative correlation set (NCS, 59 genes) and positive correlation set (PCS, 74 genes).
Figure 4. Analysis of poly(A) sites responsible for 3′UTR regulation.
(A) Conservation of proximal and distal poly(A) sites between human and mouse genomes for different groups of genes. Gene groups are based on Figure 3B. _P_-value (Chi-squared test with null hypothesis being no difference between groups) = 4.1×10⁻⁴ for proximal poly(A) sites, and = 0.45 for distal sites. (B) Conservation of sequence surrounding proximal (left) and distal (right) poly(A) sites for groups 1+2 (red line) and groups 4+5 (green line). Y-axis is average percent of identity for a given nucleotide position, which was calculated using genome alignments of human, mouse, rat, and dog. X-axis is relative position to poly(A) site, with the cleavage site set at position 0. Standard errors are indicated by vertical bars along the lines. _P_-values are based on Wilcoxon matched-pairs test comparing 2 conservation profiles from −100 nt to +100 nt. Curves were smoothed by the Lowess regression method. (C) Distribution of cUTR length (left) and aUTR length (right) for genes in the 5 groups. _P_-value (Wilcoxon rank sum test) = 0.096 for cUTR length difference between groups 1+2 and groups 4+5, and = 2.7×10⁻⁹ for aUTR length difference. (D) Comparison of frequency of occurrence for all 5-mers in different regions surrounding proximal poly(A) sites for genes in groups 1+2 vs. those in groups 4+5. As indicated in the graph, 4 regions were examined, i.e. −100 to −41 nt, −40 to −1 nt, +1 to +40 nt, and +41 to +100 nt. The poly(A) site was set at position 0. Y-axis is the significance score (see Methods for detail). Pentamers with significance score >3 or <−3 are shown in red. Significant ones after _P_-value correction by the Benjamin-Hochberg method are shown in dark red, i.e. UUUUU, UGUGU, and GUGUG.
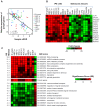
Figure 5. Gene expression analysis in generation of iPS cells.
(A) Correlation between mRNA expression of 94 poly(A) genes and nRUD values for all cell types, including before and after reprogramming and partially reprogrammed cells. Poly(A) genes are those reported in plus gene encoding Clp1 (see Table S3 for the complete list). (B) A list of genes encoding core polyadenylation factors that are consistently regulated in generation of iPS cells. Fold changes (ratio of after reprogramming to before reprogramming) are shown in a heatmap according to the color scale shown at the bottom. Only the genes with consistent trend of regulation, either upregulation or downregulation in >9 out of 10 data sets, during reprogramming of somatic cells are shown. Data for SC and different tissues in embryonic development are also shown for comparison. Human gene symbols are used to annotate genes. (C) Gene Ontology (GO) terms that are significantly associated with genes upregulated (top) and downregulated (bottom) during generation of human and mouse iPS cells from somatic cells. Significance score (SS) is used to represent _P_-values (see Methods for detail), and is shown in a heatmap according to the scale shown in the graph. The poly(A) gene group was also analyzed and is shown in the middle. Its _P_-values are <0.01 for all cell types. The median SS based on reprogramming of somatic cells is listed and used to sort GO terms. GO terms associated with more than 1,500 genes are considered too generic and are discarded. To eliminate redundancy, we require that the reported GO terms do not overlap with any other GO term with greater SS by more than 25% of associated genes.
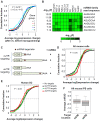
Figure 6. Impact of 3′UTR dynamics on gene expression and miRNA targeting.
(A) Distribution of expression changes for genes with different 3′UTR regulations. Gene groups are based on Figure 3B. For each gene, the ratio of cUTR probe intensity after reprogramming to that before reprogramming was calculated and averaged across data sets. The Kolmogorov-Smironov test was used to compare the combined distribution of groups 1+2 with that of groups 4+5. (B) miRNA families predicted to function in iPS cells. The _P_-values (Fisher's exact test) for significance of downregulation of miRNA target are shown in a heatmap based on the color scale shown in the graph. Seed sequences are shown to represent the miRNA families. AAGUGCA is the seed sequence for miR-291b-3p/519a/519b-3p/519c-3p, AAAGUGC for miR-17-5p/20/93.mr/106/519.d, AGUGCAA to miR-130/301, AAGUGCU for miR-106/302, AUUGCAC for miR-25/32/92/92ab/363/367, and AGUGCUU for miR-302ac/520f. (C) A model showing the impact of 3′ UTR dynamics on miRNA targeting. “x” indicates miRNA targeting, and ‘−’ indicates no miRNA effect. (D) Cumulative fraction of change of expression for different groups of genes based on miRNA target site location. Only the conserved target sites for miRNA families shown in (B) are used. The change of expression is based on ratio of after reprogramming to before reprogramming for probes targeting cUTRs, and is average of 5 mouse data sets, i.e. B lymph., MEF.a, MEF.b, NSC.a, NSC.b1, and NSC.b2. Different groups are colored differently as indicated in the graph. (E) As in (D), only the result using human SC data is presented. (F) Average ΔnRUD for genes with miRNA target sites in different UTR regions. Only the genes with target sites for the 6 miRNA families shown in (B) are used. Red dotted line indicates average ΔnRUD for all surveyed genes.
Figure 7. A model for regulation of 3′UTR by APA in proliferation/differentiation.
During proliferation, dedifferentiation, and cell transformation, high mRNA polyadenylation activity leads to usage of proximal poly(A) sites, whereas during differentiation, low mRNA polyadenylation activity leads to usage of distal poly(A) sites. The signs ‘+’ and ‘−’ indicate activation and inhibition, respectively.
Similar articles
- Evolution of Hox post-transcriptional regulation by alternative polyadenylation and microRNA modulation within 12 Drosophila genomes.
Patraquim P, Warnefors M, Alonso CR. Patraquim P, et al. Mol Biol Evol. 2011 Sep;28(9):2453-60. doi: 10.1093/molbev/msr073. Epub 2011 Mar 24. Mol Biol Evol. 2011. PMID: 21436120 - Lengthening of 3' Untranslated Regions of mRNAs by Alternative Polyadenylation Is Associated With Tumor Progression and Poor Prognosis of Clear Cell Renal Cell Carcinoma.
Zhang F, Chen L, Li W, Yang C, Xiong M, Zhou M, Kazobinka G, Zhao J, Hou T. Zhang F, et al. Lab Invest. 2023 Jun;103(6):100125. doi: 10.1016/j.labinv.2023.100125. Epub 2023 Mar 6. Lab Invest. 2023. PMID: 36889542 - Specific Tandem 3'UTR Patterns and Gene Expression Profiles in Mouse Thy1+ Germline Stem Cells.
Huang Y, Xiong Y, Lin Z, Feng X, Jiang X, Songyang Z, Huang J. Huang Y, et al. PLoS One. 2015 Dec 29;10(12):e0145417. doi: 10.1371/journal.pone.0145417. eCollection 2015. PLoS One. 2015. PMID: 26713853 Free PMC article. - The emerging theme of 3'UTR mRNA isoform regulation in reprogramming of cell metabolism.
Zhang Q, Tian B. Zhang Q, et al. Biochem Soc Trans. 2023 Jun 28;51(3):1111-1119. doi: 10.1042/BST20221128. Biochem Soc Trans. 2023. PMID: 37171086 Free PMC article. Review. - 3'UTRs take a long shot in the brain.
Wang L, Yi R. Wang L, et al. Bioessays. 2014 Jan;36(1):39-45. doi: 10.1002/bies.201300100. Epub 2013 Sep 20. Bioessays. 2014. PMID: 24115048 Free PMC article. Review.
Cited by
- All's well that ends well: alternative polyadenylation and its implications for stem cell biology.
Mueller AA, Cheung TH, Rando TA. Mueller AA, et al. Curr Opin Cell Biol. 2013 Apr;25(2):222-32. doi: 10.1016/j.ceb.2012.12.008. Epub 2013 Jan 25. Curr Opin Cell Biol. 2013. PMID: 23357469 Free PMC article. Review. - piRNA-like small RNAs mark extended 3'UTRs present in germ and somatic cells.
Yamtich J, Heo SJ, Dhahbi J, Martin DI, Boffelli D. Yamtich J, et al. BMC Genomics. 2015 Jun 16;16(1):462. doi: 10.1186/s12864-015-1662-6. BMC Genomics. 2015. PMID: 26076733 Free PMC article. - Alternative 3'-untranslated regions regulate high-salt tolerance of Spartina alterniflora.
Wang T, Ye W, Zhang J, Li H, Zeng W, Zhu S, Ji G, Wu X, Ma L. Wang T, et al. Plant Physiol. 2023 Apr 3;191(4):2570-2587. doi: 10.1093/plphys/kiad030. Plant Physiol. 2023. PMID: 36682816 Free PMC article. - 3'UTR Shortening Potentiates MicroRNA-Based Repression of Pro-differentiation Genes in Proliferating Human Cells.
Hoffman Y, Bublik DR, Ugalde AP, Elkon R, Biniashvili T, Agami R, Oren M, Pilpel Y. Hoffman Y, et al. PLoS Genet. 2016 Feb 23;12(2):e1005879. doi: 10.1371/journal.pgen.1005879. eCollection 2016 Feb. PLoS Genet. 2016. PMID: 26908102 Free PMC article. - 3'-End Processing of Eukaryotic mRNA: Machinery, Regulation, and Impact on Gene Expression.
Boreikaitė V, Passmore LA. Boreikaitė V, et al. Annu Rev Biochem. 2023 Jun 20;92:199-225. doi: 10.1146/annurev-biochem-052521-012445. Epub 2023 Mar 31. Annu Rev Biochem. 2023. PMID: 37001138 Free PMC article. Review.
References
- Rossant J. Stem cells and lineage development in the mammalian blastocyst. Reprod Fertil Dev. 2007;19:111–118. - PubMed
- Takahashi K, Yamanaka S. Induction of pluripotent stem cells from mouse embryonic and adult fibroblast cultures by defined factors. Cell. 2006;126:663–676. - PubMed
- Lowry WE, Plath K. The many ways to make an iPS cell. Nat Biotechnol. 2008;26:1246–1248. - PubMed
Publication types
MeSH terms
Substances
LinkOut - more resources
Full Text Sources
Other Literature Sources


