Effects of chronic low dose rotenone treatment on human microglial cells - PubMed (original) (raw)
Effects of chronic low dose rotenone treatment on human microglial cells
Shamim B Shaikh et al. Mol Neurodegener. 2009.
Abstract
Background: Exposure to toxins/chemicals is considered to be a significant risk factor in the pathogenesis of Parkinson's disease (PD); one putative chemical is the naturally occurring herbicide rotenone that is now used widely in establishing PD models. We, and others, have shown that chronic low dose rotenone treatment induces excessive accumulation of Reactive Oxygen Species (ROS), inclusion body formation and apoptosis in dopaminergic neurons of animal and human origin. Some studies have also suggested that microglia enhance the rotenone induced neurotoxicity. While the effects of rotenone on neurons are well established, there is little or no information available on the effect of rotenone on microglial cells, and especially cells of human origin. The aim of the present study was to investigate the effects of chronic low dose rotenone treatment on human microglial CHME-5 cells.
Methods: We have shown previously that rotenone induced inclusion body formation in human dopaminergic SH-SY5Y cells and therefore used these cells as a control for inclusion body formation in this study. SH-SY5Y and CHME-5 cells were treated with 5 nM rotenone for four weeks. At the end of week 4, both cell types were analysed for the presence of inclusion bodies, superoxide dismutases and cell activation (only in CHME-5 cells) using Haematoxylin and Eosin staining, immunocytochemical and western blotting methods. Levels of active caspases and ROS (both extra and intra cellular) were measured using biochemical methods.
Conclusion: The results suggest that chronic low dose rotenone treatment activates human microglia (cell line) in a manner similar to microglia of animal origin as shown by others. However human microglia release excessive amounts of ROS extracellularly, do not show excessive amounts of intracellular ROS and active caspases and most importantly do not show any protein aggregation or inclusion body formation. Human microglia appear to be resistant to rotenone (chronic, low dose) induced damage.
Figures
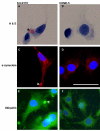
Figure 1
Detection of inclusion bodies. Representative photomicrographs showing H & E staining (A and B), α-synuclein staining (C & D) and ubiquitin staining (E and F) in the two cell types (SH-SY5Y and CHME-5) collected at the end of 4 week's of rotenone (5 nm) treatment. SH-SY5Y cells showed eosinophilic (A, arrow head), α-synuclein positive (C, arrow head) and ubiquitin positive (E, arrow head) inclusion bodies. No inclusion bodies were seen in human microglial CHME-5 cells (B, D and F). Results shown are representative of three independent experiments. Scale bar: 50 μm.
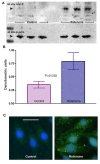
Figure 2
Glut-5 levels in microglial CHME-5 cells. Figure 2A: Representative immunoblot showing the levels of Glut-5 protein (55 kDa, first row) in the cell lysates collected at the end of week 4 from the control and rotenone (5 nm) treated CHME-5 cells. β-actin (42 kDa, second row) was used as an internal loading control. Figure 2B: Histogram showing relative semi-quantitation of Glut-5 levels. Glut-5 levels were normalised against the β-actin levels in each well and expressed in densitometric units. P (p = 0.039) value indicates a significant difference in Glut-5 levels between control and rotenone treated groups. Each column represents the mean and standard deviation from three independent experiments. Figure 2C: Representative photomicrographs showing immunostaining of CR3/43 (HLA DR/DP/DQ) in control and rotenone treated CHME-5 cells at the end of week 4 of the treatment period. CR3/43 staining is dramatically increased in rotenone treated cells as visualised by the green fluorescence. Scale bar: 50 μm.
Figure 3
Detection of Reactive Oxygen Species (ROS). Figure 3A: Detection of ROS using DHE fluorescent dye in CHME-5 and SH-SY5Y cells from the two treatment groups (DMSO control and 5 nm rotenone) at the end of week 4. Hoechst 33258 stain (blue) was used to identify the nucleus of cells. The fluorescent intensity of the red dots in the nucleus indicates the relative levels of ROS present in the cell. Scale bar: 20 μm. Figure 3B: Histogram showing the levels of ROS in each of the treatment groups in both cell types (CHME-5 and SH-SY5Y) at the end of week 4. The levels are expressed in densitometric units. P (*p > 0.05) value indicates that there was no significant difference in ROS levels between the control and rotenone treated CHME-5 cells. However rotenone treated SH-SY5Y cells showed a significant (**P < 0.001) two fold increase in the intracellular ROS levels compared to the untreated controls. Each column represents the mean and standard deviation from three independent experiments **Figure 3C**: Histogram representing the extracellular levels of ROS using the Acridan Lumigen PS-3 assay in the medium collected from both treatment groups (DMSO control and 5 nm rotenone) and both cell types (CHME-5 and SH-SY5Y) at the end of week 4. The levels are expressed in light intensity units. CHME-5 cells released significantly higher (*p < 0.001) levels of ROS in the medium compared to controls, while the extracellular release of ROS in the medium from rotenone treated and untreated SH-SY5Y cells was not significantly different (**P > 0.05). Each column represents the mean and standard deviation from three independent experiments. Figure 3D: Image showing the effects of antioxidants on chemiluminescence in the Acridan Lumigen PS-3 assay. Chemiluminescent signals were captured using Fujifilm Luminescent Image Analyzer (Dots) and light intensity units were recorded using the BioTek Synergy 2 plate reader (bar graph). a: culture medium from CHME-5 cells treated with 5 nm rotenone for 4 weeks, b: culture medium (as in a) incubated with 100 μM ascorbic acid (vitamin C) for 5 minutes, c: culture medium (as in a) incubated with NuPAGE antioxidant (1:500 diluted). The dramatic reduction of chemiluminescence in the media incubated with antioxidants indicates that the chemiluminescence in Acridan PS-3 assay is ROS specific.
Figure 4
Detection of active caspases using FLICA assay. Histogram showing the levels of active caspases in each of the treatment groups from the two cell types (CHME-5 and SH-SY5Y) at the end of week 4. The levels are expressed in fluorescence units/106 cells. P (*P > 0.05) value indicates that there was no significant difference in the level of active caspases between the rotenone treated and untreated CHME-5 cells. Rotenone treated SH-SY5Y cells showed significantly increased (**P < 0.001) levels of active caspases (fluorescence units) compared to untreated control cells. Each column represents the mean and standard deviation from three independent experiments.
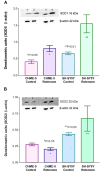
Figure 5
Superoxide dismutase (SOD) levels in both CHME-5 and SH-SY5Y cells. Figure 5A: Representative immunoblot and histogram showing levels of SOD1 in the two types of cells (CHME-5 and SH-SY5Y) collected from two treatment groups (DMSO control and rotenone treated). CHME-5 cells showed a significant (p < 0.05) two fold increase in SOD1 levels, whereas SH-SY5Y cells showed a more significant 2.4 fold increase (p < 0.01) in SOD1 levels after 4 weeks of rotenone treatment. The base levels of SOD1 appeared to be higher in SH-SY5Y cells compared to CHME-5 cells. **Figure 5B:** Representative immunoblot and histogram showing levels of SOD2 in the two types of cells (CHME-5 and SH-SY5Y) collected from two treatment groups (DMSO control and rotenone treated). CHME-5 cells did not show any change in SOD2 levels (p > 0.05), whereas SH-SY5Y cells showed a 1.5 fold increase in SOD2 levels after 4 weeks of rotenone treatment, although this increase was not significant (p > 0.05). The base levels of SOD2 appeared to be higher in SH-SY5Y cells compared to CHME-5 cells. 1: CHME-5 control; 2: CHME-5 rotenone; 3: SH-SY5Y control; 4: SH-SY5Y rotenone. Each column represents the mean and standard deviation from three independent experiments.
Similar articles
- Critical role for microglial NADPH oxidase in rotenone-induced degeneration of dopaminergic neurons.
Gao HM, Liu B, Hong JS. Gao HM, et al. J Neurosci. 2003 Jul 16;23(15):6181-7. doi: 10.1523/JNEUROSCI.23-15-06181.2003. J Neurosci. 2003. PMID: 12867501 Free PMC article. - Ultrafine carbon particles promote rotenone-induced dopamine neuronal loss through activating microglial NADPH oxidase.
Wang Y, Liu D, Zhang H, Wang Y, Wei L, Liu Y, Liao J, Gao HM, Zhou H. Wang Y, et al. Toxicol Appl Pharmacol. 2017 May 1;322:51-59. doi: 10.1016/j.taap.2017.03.005. Epub 2017 Mar 7. Toxicol Appl Pharmacol. 2017. PMID: 28283350 - Epigallocatechin gallate (EGCG) potentiates the cytotoxicity of rotenone in neuroblastoma SH-SY5Y cells.
Chung WG, Miranda CL, Maier CS. Chung WG, et al. Brain Res. 2007 Oct 24;1176:133-42. doi: 10.1016/j.brainres.2007.07.083. Epub 2007 Aug 22. Brain Res. 2007. PMID: 17900545 Free PMC article. - Vitamin K2 suppresses rotenone-induced microglial activation in vitro.
Yu YX, Li YP, Gao F, Hu QS, Zhang Y, Chen D, Wang GH. Yu YX, et al. Acta Pharmacol Sin. 2016 Sep;37(9):1178-89. doi: 10.1038/aps.2016.68. Epub 2016 Aug 8. Acta Pharmacol Sin. 2016. PMID: 27498777 Free PMC article. - Microglial Activation Mediates Noradrenergic Locus Coeruleus Neurodegeneration via Complement Receptor 3 in a Rotenone-Induced Parkinson's Disease Mouse Model.
Jing L, Hou L, Zhang D, Li S, Ruan Z, Zhang X, Hong JS, Wang Q. Jing L, et al. J Inflamm Res. 2021 Apr 9;14:1341-1356. doi: 10.2147/JIR.S299927. eCollection 2021. J Inflamm Res. 2021. PMID: 33859489 Free PMC article.
Cited by
- Microglial AGE-albumin is critical for neuronal death in Parkinson's disease: a possible implication for theranostics.
Bayarsaikhan E, Bayarsaikhan D, Lee J, Son M, Oh S, Moon J, Park HJ, Roshini A, Kim SU, Song BJ, Jo SM, Byun K, Lee B. Bayarsaikhan E, et al. Int J Nanomedicine. 2016 Aug 23;10 Spec Iss(Spec Iss):281-92. doi: 10.2147/IJN.S95077. eCollection 2015. Int J Nanomedicine. 2016. PMID: 27601894 Free PMC article. - Measurement of reactive oxygen species in the culture media using Acridan Lumigen PS-3 assay.
Uy B, McGlashan SR, Shaikh SB. Uy B, et al. J Biomol Tech. 2011 Sep;22(3):95-107. J Biomol Tech. 2011. PMID: 21966257 Free PMC article. - The human microglial HMC3 cell line: where do we stand? A systematic literature review.
Dello Russo C, Cappoli N, Coletta I, Mezzogori D, Paciello F, Pozzoli G, Navarra P, Battaglia A. Dello Russo C, et al. J Neuroinflammation. 2018 Sep 10;15(1):259. doi: 10.1186/s12974-018-1288-0. J Neuroinflammation. 2018. PMID: 30200996 Free PMC article. Review. - Evaluation of intracellular processes in quinolinic acid-induced brain damage by imaging reactive oxygen species generation and mitochondrial complex I activity.
Hosoi R, Fujii Y, Hiroyuki O, Shukuri M, Nishiyama S, Kanazawa M, Todoroki K, Arano Y, Sakai T, Tsukada H, Inoue O. Hosoi R, et al. EJNMMI Res. 2021 Oct 9;11(1):99. doi: 10.1186/s13550-021-00841-3. EJNMMI Res. 2021. PMID: 34628558 Free PMC article. - Expression of mutant alpha-synuclein modulates microglial phenotype in vitro.
Rojanathammanee L, Murphy EJ, Combs CK. Rojanathammanee L, et al. J Neuroinflammation. 2011 May 9;8:44. doi: 10.1186/1742-2094-8-44. J Neuroinflammation. 2011. PMID: 21554732 Free PMC article.
References
- Hirsch EC, Hunot S, Damier P, Faucheux B. Glial cells and inflammation in Parkinson's disease: a role in neurodegeneration? Ann Neurol. 1998;44:S115–120. - PubMed
- McGeer PL, Itagaki S, Boyes BE, McGeer EG. Reactive microglia are positive for HLA-DR in the substantia nigra of Parkinson's and Alzheimer's disease brains. Neurology. 1988;38:1285–1291. - PubMed
LinkOut - more resources
Full Text Sources


