Assembly of the biogenesis of lysosome-related organelles complex-3 (BLOC-3) and its interaction with Rab9 - PubMed (original) (raw)
Assembly of the biogenesis of lysosome-related organelles complex-3 (BLOC-3) and its interaction with Rab9
Daniel P Kloer et al. J Biol Chem. 2010.
Abstract
The Hermansky-Pudlak syndrome (HPS) is a genetic hypopigmentation and bleeding disorder caused by defective biogenesis of lysosome-related organelles (LROs) such as melanosomes and platelet dense bodies. HPS arises from mutations in any of 8 genes in humans and 16 genes in mice. Two of these genes, HPS1 and HPS4, encode components of the biogenesis of lysosome-related organelles complex-3 (BLOC-3). Herein we show that recombinant HPS1-HPS4 produced in insect cells can be efficiently isolated as a 1:1 heterodimer. Analytical ultracentrifugation reveals that this complex has a molecular mass of 146 kDa, equivalent to that of the native complex and to the sum of the predicted molecular masses of HPS1 and HPS4. This indicates that HPS1 and HPS4 interact directly in the absence of any other protein as part of BLOC-3. Limited proteolysis and deletion analyses show that both subunits interact with one another throughout most of their lengths with the sole exception of a long, unstructured loop in the central part of HPS4. An interaction screen reveals a specific and strong interaction of BLOC-3 with the GTP-bound form of the endosomal GTPase, Rab9. This interaction is mediated by HPS4 and the switch I and II regions of Rab9. These characteristics indicate that BLOC-3 might function as a Rab9 effector in the biogenesis of LROs.
Figures
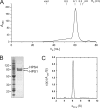
FIGURE 1.
Hydrodynamic properties of BLOC-3. A, gel filtration profile of recombinant BLOC-3 on a Superose 6 column in 0.6% (w/v) β-OG. The hydrodynamic radii of standard proteins are indicated. B, Coomassie Blue-stained gel of purified BLOC-3 complex after gel filtration. Molecular masses are indicated in kDa. C, analytical ultracentrifugation of BLOC-3 at 4 °C in 0.6% (w/v) β-OG. Analysis using one species for the c(s) distribution results in a molecular mass of 146 kDa and an f/f0 ratio of 1.65.
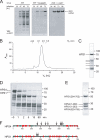
FIGURE 2.
Protease sensitivity and mapping of disordered regions. A, Sf9 cells were infected with either wild-type or a cathepsin/chitinase (v-cath/chiA)-deficient baculovirus expressing GST-HPS4 and HPS1. Total cell lysates taken at the indicated time points after infection were analyzed by immunoblotting using an antibody to GST. B, gel filtration profile of recombinant BLOC-3 after autoproteolytic digestion. The hydrodynamic radii of standard proteins are indicated. C, Coomassie Blue-stained SDS-PAGE of the peak fraction from the gel filtration shown in B. In addition to full-length HPS1, several smaller HPS1 and HPS4 fragments remain tightly associated in the complex (arrows). D, limited proteolysis with trypsin. Full-length recombinant BLOC-3 was incubated with 2 μg/ml trypsin at room temperature and aliquots taken at the indicated time points. E, BLOC-3 was proteolysed with trypsin for 15 min and loaded onto a Superdex 200 gel filtration column. The four major bands in the 15-min digest (D) remain tightly associated and co-elute in the peak fraction. However, the central region in HPS4 between 268 and 529 dissociates from the rest of the complex and is not present in the peak fraction. The gels in C through E were stained with Coomassie Blue, molecular masses are indicated in kDa. F, all protease cleavage sites in BLOC-3 are located in regions lacking predicted secondary structure. Mapped sites from autoproteolysis (open arrowheads) and limited trypsin proteolysis (closed) are shown together with predicted secondary structure elements for HPS1 and HPS4 (α-helices, red; β-strands, green).
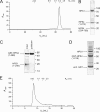
FIGURE 3.
Assembly of the BLOC-3 complex. A, gel filtration profile of the BLOC-3 complex after removal of HPS4 residues 275–533 using flanking TEV sites. B, Coomassie Blue-stained peak fraction from the gel filtration shown in A. The N-terminal (1–274) and C-terminal (534–708) fragments of HPS4 remain tightly associated with HPS1, whereas the central region dissociates from the complex, showing that it is not needed for complex stability. C, N-terminal domains of HPS1 and HPS4 do not form a stable complex. GST-HPS4-(1–268) and HPS1-(1–248) were co-expressed, captured on glutathione resin, and detected by immunoblot using a rabbit polyclonal antibody against the full-length BLOC-3 complex. D, HPS4 N-terminal domain (1–218) interacts with full-length HPS1. Co-expression of GST-HPS4-(1–218) and full-length HPS1 followed by capture on glutathione resin and Coomassie Blue staining. Molecular masses in C and D are indicated in kDa. E, N-terminal domain of HPS4 forms soluble aggregates. Elution profile of HPS4-(1–218) on a Superdex 200 column after removal of the GST tag and ion exchange chromatography.
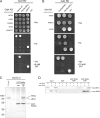
FIGURE 4.
GTP-dependent interaction of BLOC-3 with Rab9. A, Y2H assay of HPS1 and HPS4 binding to wild-type and GTP-locked (Q66L) Rab9a. B, Y2H assay of HPS4 binding to GTP-locked (Q66L) Rab9a and Rab9b. Negative and positive controls for interactions are described under “Experimental Procedures.” C, GST pulldown using purified recombinant BLOC-3 (200 n
m
) and immobilized wild-type GST-Rab9a (100 n
m
) loaded with either GDP or GMP-PNP. Coomassie Blue-stained gel. Molecular masses are indicated in kDa. D, GST pulldown using lysates from COS-7 cells expressing HA-HPS1, Myc-HPS4, or both. Lysates were passed over GST or GST-Rab9a loaded with GTP or GDP and bound proteins detected by immunoblotting with anti-HA and anti-Myc antibodies.
FIGURE 5.
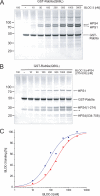
Deleting the central region of HPS4 does not impair Rab9 binding. A, GST pulldown with different concentrations of recombinant BLOC-3 and GTP-locked GST-Rab9a at 100 n
m
. B, GST pulldown with different concentrations of recombinant BLOC-3(ΔHPS4275–533) and GTP-locked GST-Rab9a at 100 n
m
. A GST contaminant is marked by an asterisk. Molecular masses in A and B are indicated in kDa. C, quantification of the titrations in A and B. The amount of bound BLOC-3 was determined by Coomassie Blue G250 fluorescence, normalized to the amount of GST-Rab9 in each lane and plotted against BLOC-3 concentration. Fitting the data assuming 1:1 binding stoichiometry results in a KD of 82 n
m
for full-length BLOC-3 (blue) and 202 n
m
for BLOC-3(ΔHPS4275–533) (red).
FIGURE 6.
The interaction of BLOC-3 with Rab9 is Rab-specific. A, GST pulldown using purified recombinant BLOC-3 (200 n
m
) and immobilized wild-type GST-Rab5a, -Rab7a, -Rab9a, and -Rab27a (100 n
m
) loaded with either GDP or GTPγS. Coomassie Blue-stained gel. Molecular masses are indicated in kDa. B, GST pulldown using mouse spleen cytosol and GST-Rab4a, -Rab7a and -Rab9a loaded with GTP or GDP as bait. Endogenous HPS4 protein was detected using an affinity-purified polyclonal antibody.
FIGURE 7.
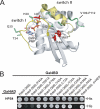
Mapping the binding site on Rab9. A, scheme of Rab9-GMP-PNP in the active conformation (PDB 1YZL) with the residues mutated to alanine in B shown in stick representation. The switch I and II regions are colored yellow. Point mutations causing loss of HPS4 binding are highlighted in red and those with no effect in green. Deletion of the Val-109-Pro-112 loop (green backbone) also had no effect. B, Y2H assay of Rab9a(Q66L) binding to HPS4. Residues on the Rab9a surface were mutated to alanine as indicated. The ΔVKEP mutation (far right) refers to the Val-109—Pro-112 loop, which only occurs in Rab7, Rab9, Rab32, and Rab38.
Similar articles
- Biogenesis of lysosome-related organelles complex 3 (BLOC-3): a complex containing the Hermansky-Pudlak syndrome (HPS) proteins HPS1 and HPS4.
Nazarian R, Falcón-Pérez JM, Dell'Angelica EC. Nazarian R, et al. Proc Natl Acad Sci U S A. 2003 Jul 22;100(15):8770-5. doi: 10.1073/pnas.1532040100. Epub 2003 Jul 7. Proc Natl Acad Sci U S A. 2003. PMID: 12847290 Free PMC article. - The Hermansky-Pudlak syndrome 1 (HPS1) and HPS4 proteins are components of two complexes, BLOC-3 and BLOC-4, involved in the biogenesis of lysosome-related organelles.
Chiang PW, Oiso N, Gautam R, Suzuki T, Swank RT, Spritz RA. Chiang PW, et al. J Biol Chem. 2003 May 30;278(22):20332-7. doi: 10.1074/jbc.M300090200. Epub 2003 Mar 27. J Biol Chem. 2003. PMID: 12663659 - A divalent interaction between HPS1 and HPS4 is required for the formation of the biogenesis of lysosome-related organelle complex-3 (BLOC-3).
Carmona-Rivera C, Simeonov DR, Cardillo ND, Gahl WA, Cadilla CL. Carmona-Rivera C, et al. Biochim Biophys Acta. 2013 Mar;1833(3):468-78. doi: 10.1016/j.bbamcr.2012.10.019. Epub 2012 Oct 23. Biochim Biophys Acta. 2013. PMID: 23103514 Free PMC article. - Rab38 Mutation and the Lung Phenotype.
Osanai K. Osanai K. Int J Mol Sci. 2018 Jul 27;19(8):2203. doi: 10.3390/ijms19082203. Int J Mol Sci. 2018. PMID: 30060521 Free PMC article. Review. - The building BLOC(k)s of lysosomes and related organelles.
Dell'Angelica EC. Dell'Angelica EC. Curr Opin Cell Biol. 2004 Aug;16(4):458-64. doi: 10.1016/j.ceb.2004.05.001. Curr Opin Cell Biol. 2004. PMID: 15261680 Review.
Cited by
- BLOC-2, AP-3, and AP-1 proteins function in concert with Rab38 and Rab32 proteins to mediate protein trafficking to lysosome-related organelles.
Bultema JJ, Ambrosio AL, Burek CL, Di Pietro SM. Bultema JJ, et al. J Biol Chem. 2012 Jun 1;287(23):19550-63. doi: 10.1074/jbc.M112.351908. Epub 2012 Apr 16. J Biol Chem. 2012. PMID: 22511774 Free PMC article. - Review series: Rab GTPases and membrane identity: causal or inconsequential?
Barr FA. Barr FA. J Cell Biol. 2013 Jul 22;202(2):191-9. doi: 10.1083/jcb.201306010. J Cell Biol. 2013. PMID: 23878272 Free PMC article. Review. - Annexins-Coordinators of Cholesterol Homeostasis in Endocytic Pathways.
Rentero C, Blanco-Muñoz P, Meneses-Salas E, Grewal T, Enrich C. Rentero C, et al. Int J Mol Sci. 2018 May 12;19(5):1444. doi: 10.3390/ijms19051444. Int J Mol Sci. 2018. PMID: 29757220 Free PMC article. Review. - DOCK11 and DENND2A play pivotal roles in the maintenance of hepatitis B virus in host cells.
Hashimoto S, Shirasaki T, Yamashita T, Iwabuchi S, Suzuki Y, Takamura Y, Ukita Y, Deshimaru S, Okayama T, Ikeo K, Kuroki K, Kawaguchi K, Mizukoshi E, Matsushima K, Honda M, Kaneko S. Hashimoto S, et al. PLoS One. 2021 Feb 4;16(2):e0246313. doi: 10.1371/journal.pone.0246313. eCollection 2021. PLoS One. 2021. PMID: 33539396 Free PMC article. - BLOC-3 mutated in Hermansky-Pudlak syndrome is a Rab32/38 guanine nucleotide exchange factor.
Gerondopoulos A, Langemeyer L, Liang JR, Linford A, Barr FA. Gerondopoulos A, et al. Curr Biol. 2012 Nov 20;22(22):2135-9. doi: 10.1016/j.cub.2012.09.020. Epub 2012 Oct 18. Curr Biol. 2012. PMID: 23084991 Free PMC article.
References
- Hermansky F., Pudlak P. (1959) Blood 14, 162–169 - PubMed
- Dell'Angelica E. C., Mullins C., Caplan S., Bonifacino J. S. (2000) FASEB J. 14, 1265–1278 - PubMed
- Li W., Rusiniak M. E., Chintala S., Gautam R., Novak E. K., Swank R. T. (2004) Bioessays 26, 616–628 - PubMed
Publication types
MeSH terms
Substances
LinkOut - more resources
Full Text Sources
Molecular Biology Databases
