Amygdala neural encoding of the absence of reward during extinction - PubMed (original) (raw)
Comparative Study
Amygdala neural encoding of the absence of reward during extinction
Kay M Tye et al. J Neurosci. 2010.
Abstract
The basolateral amygdala complex (BLA) has been identified as a critical structure mediating fear extinction. However, little is known about the functional role of neurons in the BLA during the extinction of a reward-seeking behavior. Here, we used in vivo electrophysiology procedures in freely moving rats to investigate whether and how the BLA encodes the extinction of responding for sucrose. We recorded 330 neurons from 15 rats during a within-session extinction procedure following training under a partial reinforcement schedule. Several distinct populations of neurons change their response profiles as the rat ceases to respond for the omitted reinforcer. One population of neurons (32 of 330; 10%), which responded selectively to port entries in the presence, but not the absence, of sucrose during maintenance, subsequently developed a phasic response to port entries in the absence of sucrose during the extinction epoch only. The relative proportion of these "reinforcement-omission" neurons per rat was correlated with response intensity during extinction, as well as with the rate at which reward-seeking behavior was extinguished. A subpopulation of neurons responded with opposite phasic changes in activity to port entries in the presence of sucrose and to port entries during extinction, demonstrating that BLA neurons may contribute to the detection of value differences between expected and actual outcomes. Another population of neurons (47 of 330; 14%) responded to the empty port only during extinction. Because BLA neural correlates reflect the omission of an expected reward, these neuronal populations may contribute to the expression of behavior during extinction.
Figures
Figure 1.
In vivo electrophysiological recording of basolateral amygdala neurons. A, Coronal diagrams showing chronic recording electrode tip placements (gray circles). Numbers on left indicate the anteroposterior coordinates caudal to bregma (Paxinos and Watson, 1998). B, Representative waveforms from single units recorded from a single electrode tip located in the BLA. C, Corresponding cluster analysis for representative units isolated using principle component analysis. PC1, Principle component 1; PC2, principle component 2.
Figure 2.
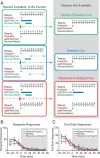
Diagram of behavioral procedures and behavioral responding. A, Rats were trained for 5 d on one of three partial reinforcement procedures (“reward-predictive cue,” “random cue,” and “response-contingent cue”) wherein ∼50% of operant responses at a nosepoke operandum were reinforced with subsequent sucrose delivery at an adjacent port. On the sixth day, an abbreviated training session was immediately followed by an unexpected within-session extinction procedure wherein operant responses were not reinforced and sucrose solution was not available. B, C, Mean nosepoke (B) or port entry (C) responses (in 10 min bins) are shown across the maintenance and extinction segments of the within-session extinction procedure for each treatment group (n = 5 rats each group); error bars indicate SEM.
Figure 3.
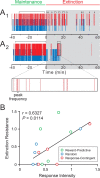
Changes in behavioral patterns that occur upon within-session extinction are variable. A, Behavioral rasters from two representative rats. A1, A behavioral raster from a rat that is more resistant to extinction than the rat in A2. Red ticks represent nosepoke responses, and blue ticks represent port entries. Time = 0 signals the onset of the extinction session. Gray shading indicates extinction epochs during which sucrose reinforcement is unavailable. Horizontal brackets above rasters indicate bursts of nosepoke responses, as determined by burst analysis. Expanded box is an example depicting the peak frequency within the example burst. B, Extinction resistance is significantly correlated with response intensity. Extinction resistance is calculated by dividing the rate of nosepoke responding during the last 10 min of the extinction epoch by the rate of nosepoke responding during the entire extinction epoch. Response intensity is defined as the mean peak frequency within a nosepoke burst during extinction normalized to the mean peak frequency during maintenance for each rat. Training procedure for each rat is indicated by color: green indicates training with the “reward-predictive cue” procedure, blue indicates training with the “random cue” procedure, and red indicates training with the “response-contingent cue” procedure; these colors will reflect the respective training procedures in all subsequent figures.
Figure 4.
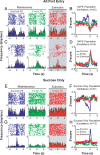
One population of BLA neurons responds to all port entries regardless of condition, while another population of neurons responds to port entries only when sucrose is present. A–D, Of 31 neurons that responded to all three PE conditions, 28 neurons responded to all port entry conditions with similar phasic responses. Perievent raster histograms show neural activity when the rat enters the sucrose delivery port under three conditions: (1) during maintenance when the port is filled with sucrose, (2) during maintenance when the port is empty, and (3) during extinction, when the port is always empty. Gray shading indicates epochs when sucrose is unavailable. For all perievent raster histograms, the port entry beam break occurs at time = 0. A, Example perievent raster histograms from a neuron that is inhibited upon all port entries in maintenance and extinction. B, Population perievent histograms of mean normalized firing rate from the 23 neurons that displayed phasic inhibitions upon all port entries. C, Example perievent raster histograms from a neuron that is excited upon all port entries during maintenance and extinction. D, Population perievent histograms from the five neurons that are excited by all port entries in maintenance and extinction. E, Example perievent raster histograms from a neuron that is inhibited only during port entries when sucrose is present. F, Population perievent histograms from the 37 neurons that displayed phasic inhibitions upon port entries in the presence of sucrose. G, Example perievent raster histograms from a neuron that showed a phasic excitation upon port entry in the presence of sucrose. H, Population perievent histograms from the 13 neurons that displayed phasic excitations upon port entries when sucrose was present.
Figure 5.
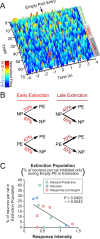
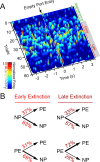
A subpopulation of neurons developed a phasic inhibition to the empty port during acquisition of extinction. Early extinction began at the onset of the extinction epoch, when sucrose was unavailable. Late extinction is defined as beginning on the first trial when the latency between the nosepoke response and the subsequent port entry is 2 SDs greater than the session mean. A, Temporal dynamics of three neurons that developed a phasic inhibition to the empty port from a representative rat. Surface plot of normalized firing rate was calculated using 150 ms bins, and was smoothed for ±1 trial. B, Microanalysis of behavior during the extinction epoch. Given that a nosepoke response occurred, the probability of occurrence of the next behavioral response did not change from early to late extinction. Given that a port entry occurred, the probability that the rat would perform another port entry before performing a nosepoke increased during late extinction (p < 0.05). C, The proportion of neurons that developed a phasic inhibition upon empty port entry only during extinction was inversely correlated with response intensity.
Figure 6.
A subpopulation of neurons developed a phasic excitation to the empty port during acquisition of extinction. A, Temporal dynamics of a BLA neuron that developed a phasic excitation to the empty port during extinction from another representative rat. Surface plot of normalized firing rate was calculated using 150 ms bins, and was smoothed for ±1 trial. B, This rat also shows an increase in the probability of performing another port entry following a port entry during late extinction, relative to early extinction (p < 0.05).
Figure 7.
A population of BLA neurons selectively responded to empty port entries during the extinction epoch only. Of the 47 neurons in the “extinction-only” population that selectively responded to extinction PEs, 41 responded with phasic inhibitions. A, Example perievent raster histograms from a neuron that developed a phasic inhibition to empty port entries only during the extinction epoch. B, Population histogram of normalized activity for the 31 neurons that are inhibited only during extinction: the 10 neurons that displayed tonic changes in firing rate were not included in this population histogram. C, Example perievent raster histograms from a neuron that developed a phasic excitation to empty port entries only during the extinction epoch. D, Population histograms for the six neurons that are excited by port entries only during extinction.
Figure 8.
A subpopulation of BLA neurons that encoded port entries in the presence of the sucrose reinforcer developed a phasic response to the empty port only during the extinction epoch and predicts response intensity and extinction resistance. A, A representative BLA neuron that was inhibited by port entries when sucrose is present, did not respond to port entries when sucrose was absent during maintenance, but developed a phasic inhibition upon port entries when sucrose was absent during extinction only. B, Population histograms of normalized activity for each port entry condition including the 22 neurons that displayed a similar response profile to that of the representative neuron in A. C, A representative BLA neuron that was excited by port entries when sucrose is present, did not respond upon port entries when sucrose was absent during maintenance, but was inhibited by port entries when sucrose was absent during extinction. D, Population histograms showing normalized activity in each port entry condition for neurons with response profiles such as the neurons shown in C. E, The proportion of neurons in the “reinforcement-omission” population recorded per rat was significantly correlated with each rat's response intensity (E) and extinction resistance (F).
Similar articles
- Amygdala neurons differentially encode motivation and reinforcement.
Tye KM, Janak PH. Tye KM, et al. J Neurosci. 2007 Apr 11;27(15):3937-45. doi: 10.1523/JNEUROSCI.5281-06.2007. J Neurosci. 2007. PMID: 17428967 Free PMC article. - Inactivation of the basolateral amygdala during opiate reward learning disinhibits prelimbic cortical neurons and modulates associative memory extinction.
Sun N, Laviolette SR. Sun N, et al. Psychopharmacology (Berl). 2012 Aug;222(4):645-61. doi: 10.1007/s00213-012-2665-5. Epub 2012 Mar 21. Psychopharmacology (Berl). 2012. PMID: 22430028 - The role of different subregions of the basolateral amygdala in cue-induced reinstatement and extinction of food-seeking behavior.
McLaughlin RJ, Floresco SB. McLaughlin RJ, et al. Neuroscience. 2007 Jun 8;146(4):1484-94. doi: 10.1016/j.neuroscience.2007.03.025. Epub 2007 Apr 20. Neuroscience. 2007. PMID: 17449185 - Orbitofrontal Cortex Mediates Sustained Basolateral Amygdala Encoding of Cued Reward-Seeking States.
Ottenheimer DJ, Vitale KR, Ambroggi F, Janak PH, Saunders BT. Ottenheimer DJ, et al. J Neurosci. 2024 Nov 13;44(46):e0013242024. doi: 10.1523/JNEUROSCI.0013-24.2024. J Neurosci. 2024. PMID: 39353730 - Amygdala Reward Neurons Form and Store Fear Extinction Memory.
Zhang X, Kim J, Tonegawa S. Zhang X, et al. Neuron. 2020 Mar 18;105(6):1077-1093.e7. doi: 10.1016/j.neuron.2019.12.025. Epub 2020 Jan 14. Neuron. 2020. PMID: 31952856
Cited by
- Neural correlates of two different types of extinction learning in the amygdala central nucleus.
Iordanova MD, Deroche ML, Esber GR, Schoenbaum G. Iordanova MD, et al. Nat Commun. 2016 Aug 17;7:12330. doi: 10.1038/ncomms12330. Nat Commun. 2016. PMID: 27531638 Free PMC article. - Attention-related Pearce-Kaye-Hall signals in basolateral amygdala require the midbrain dopaminergic system.
Esber GR, Roesch MR, Bali S, Trageser J, Bissonette GB, Puche AC, Holland PC, Schoenbaum G. Esber GR, et al. Biol Psychiatry. 2012 Dec 15;72(12):1012-9. doi: 10.1016/j.biopsych.2012.05.023. Epub 2012 Jul 3. Biol Psychiatry. 2012. PMID: 22763185 Free PMC article. - Histone-mediated epigenetics in addiction.
Hitchcock LN, Lattal KM. Hitchcock LN, et al. Prog Mol Biol Transl Sci. 2014;128:51-87. doi: 10.1016/B978-0-12-800977-2.00003-6. Prog Mol Biol Transl Sci. 2014. PMID: 25410541 Free PMC article. Review. - Knockdown of zif268 in the Posterior Dorsolateral Striatum Does Not Enduringly Disrupt a Response Memory of a Rewarded T-Maze Task.
Cahill EN, Vousden GH, Exton-McGuinness MTJ, Beh IRC, Swerner CB, Macak M, Abas S, Cole CC, Kelleher BF, Everitt BJ, Milton AL. Cahill EN, et al. Neuroscience. 2018 Feb 1;370:112-120. doi: 10.1016/j.neuroscience.2017.07.014. Epub 2017 Jul 21. Neuroscience. 2018. PMID: 28736133 Free PMC article. - Dynorphin/kappa opioid receptor system regulation on amygdaloid circuitry: Implications for neuropsychiatric disorders.
Limoges A, Yarur HE, Tejeda HA. Limoges A, et al. Front Syst Neurosci. 2022 Oct 5;16:963691. doi: 10.3389/fnsys.2022.963691. eCollection 2022. Front Syst Neurosci. 2022. PMID: 36276608 Free PMC article. Review.
References
- Abler B, Walter H, Erk S. Neural correlates of frustration. Neuroreport. 2005;16:669–672. - PubMed
- Amsel A. The role of frustrative nonreward in noncontinuous reward situations. Psychol Bull. 1958;55:102–119. - PubMed
- Amsel A, Roussel J. Motivational properties of frustration. I. Effect on a running response of the addition of frustration to the motivational complex. J Exp Psychol. 1952;43:363–366. - PubMed
- Baxter MG, Murray EA. The amygdala and reward. Nat Rev Neurosci. 2002;3:563–573. - PubMed
Publication types
MeSH terms
LinkOut - more resources
Full Text Sources

