Genome-wide analysis of PTB-RNA interactions reveals a strategy used by the general splicing repressor to modulate exon inclusion or skipping - PubMed (original) (raw)
. 2009 Dec 25;36(6):996-1006.
doi: 10.1016/j.molcel.2009.12.003.
Yu Zhou, Tongbin Wu, Tuo Zhu, Xiong Ji, Young-Soo Kwon, Chao Zhang, Gene Yeo, Douglas L Black, Hui Sun, Xiang-Dong Fu, Yi Zhang
Affiliations
- PMID: 20064465
- PMCID: PMC2807993
- DOI: 10.1016/j.molcel.2009.12.003
Genome-wide analysis of PTB-RNA interactions reveals a strategy used by the general splicing repressor to modulate exon inclusion or skipping
Yuanchao Xue et al. Mol Cell. 2009.
Abstract
Recent transcriptome analysis indicates that > 90% of human genes undergo alternative splicing, underscoring the contribution of differential RNA processing to diverse proteomes in higher eukaryotic cells. The polypyrimidine tract-binding protein PTB is a well-characterized splicing repressor, but PTB knockdown causes both exon inclusion and skipping. Genome-wide mapping of PTB-RNA interactions and construction of a functional RNA map now reveal that dominant PTB binding near a competing constitutive splice site generally induces exon inclusion, whereas prevalent binding close to an alternative site often causes exon skipping. This positional effect was further demonstrated by disrupting or creating a PTB-binding site on minigene constructs and testing their responses to PTB knockdown or overexpression. These findings suggest a mechanism for PTB to modulate splice site competition to produce opposite functional consequences, which may be generally applicable to RNA-binding splicing factors to positively or negatively regulate alternative splicing in mammalian cells.
2009 Elsevier Inc.
Figures
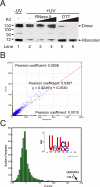
Figure 1. Extensive PTB-PTB and PTB-RNA interactions in vivo
(A) Western blotting analysis of immunoprecipitated PTB from mock-treated and UV-treated HeLa cells. The protein was resolved by SDS-PAGE in the presence of either 1 mM (non-reducing) or 10 mM (reducing) DTT as indicated. (B) Overlapping binding with monomeric and dimeric PTB. The Pearson coefficient between monomeric and dimeric tags in a 500 bp window across the whole genome is high (0.9387), which contrasts the lack of correlation between randomized tags and monomeric tags (0.0015) or dimeric tags (0.0008) (See Fig. S5 for further details). (C) Over-represented PTB binding motifs identified by CLIP-seq. Histogram of Z-scores indicates the enrichment of hexamers in CLIP-seq clusters compared to randomly chosen regions of similar sizes in the same genes. Z-score of the top hexamer is indicated. Insert shows the PTB binding consensus calculated from the top 20 enriched hexamers.
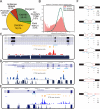
Figure 2. Genomic landscape of PTB binding
(A) The distribution of PTB tags in the human genome (hg18). (B) The distribution of PTB binding clusters relative to one another in the same genes. (C) Screen shot of PTB binding around the well-characterized nPTB exon 10. (D) Screen shot of PTB binding around TPM2 exon 7 and the two alternative polyadenylation sites. (E) Screen shot of PTB binding in the intron proceeding the regulated exon 9 in PKM2 gene. (F) PTB binding clusters associated with six major alternative RNA processing modes. The patterns of PTB binding in 250nt intronic and 30nt exonic regions around splice sites were counted. The filled black boxes indicate constitutive exons or exonic regions, whereas empty red boxes show alternative exons or exonic regions. The short blue lines mark the regions where PTB binding clusters were present (+) or absent (-). The number is the total events of PTB binding at each location.
Figure 3. PTB-dependent inclusion of alternative exon
(A) Schematic representation of the CTTN minigene constructs, showing both wild-type and the mutant that lacks the 44nt PTB-binding cluster. The mapped PTB binding site is marked in grey and the PCR primers used to detect alternatively spliced products are indicated by arrows. (B) Exogenously expressed PTB isoforms and nPTB in double PTB/nPTB knockdown cells. (C) Semi-quantitative RT-PCR analysis of wt and mutant CTTN pre-mRNA splicing in response to PTB/nPTB knockdown with or without complementation with exogenously expressed PTB isoforms or nPTB. (D) Quantification of the data as in (C) based on three independent experiments. Error bars are based on SEM; the statistical significance is determined by student _t_-test (P-value<0.05).
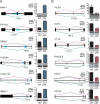
Figure 4. PTB can either represses or enhances alternative splicing in vivo
(A) Examples of PTB-dependent exon skipping. Each is schematically diagramed (exon: black box, intron: black line) with mapped PTB binding clusters as marked by blue boxes. PTB RNAi induced splicing changes are shown on the right. Error bars are based on SEM from three independent experiments. All detected changes are significant as determined by the Student's _t_-test (P-value<0.05). (B) Examples of PTB-dependent exon inclusion with mapped PTB binding clusters marked by brown boxes. For NUF2, PTB tags (not clusters) are shown under the intron line.
Figure 5. Composite functional map of PTB-regulated splicing
(A) PTB-regulated cassette exons are collected from previously reported cases and those that are validated in the present study. Among 55 PTB-regulated splicing events compiled, 14 exhibited PTB-depended splicing inclusion and 41 showed PTB-depended exon skipping. (B) RNA map on constitutive exons. Red line shows the average of normalized complexity of 100 sets (each contains 50 randomly selected exons) of constitutive exons, the upper and lower light blue boundaries show the one standard deviation (see Methods for further details).
Figure 6. Mechanism of PTB-dependent exon inclusion
(A) The reporter construct. pM17 is derived from pZW8-ESS17 (Wang et al, 2004) with a _cis_-acting regulatory element disrupted by the inserted sequence in the alternative SIRT1 exon. Four positions are selected for inserting a PTB binding site as diagrammed. (B) Splicing of the parental and mutant reporters in transfected HeLa cells was determined by RT-PCR (representative gel images shown as inserts) and quantified. (C and D) PTB-dependent exon inclusion through the inserted PTB binding sites. The effect on exon inclusion was diminished by the shRNAs against PTB and nPTB in co-transfected HeLa cells (C). The effect on exon inclusion could be further enhanced by PTB overexpression (D). Together, these results demonstrate that PTB is directly involved in enhancing exon inclusion through the inserted binding sites. Error bars are based on SEM derived from three independent experiments.
Comment in
- RNA processing: Redrawing the map of charted territory.
Corrionero A, Valcárcel J. Corrionero A, et al. Mol Cell. 2009 Dec 25;36(6):918-9. doi: 10.1016/j.molcel.2009.12.004. Mol Cell. 2009. PMID: 20064456
Similar articles
- Exon repression by polypyrimidine tract binding protein.
Amir-Ahmady B, Boutz PL, Markovtsov V, Phillips ML, Black DL. Amir-Ahmady B, et al. RNA. 2005 May;11(5):699-716. doi: 10.1261/rna.2250405. RNA. 2005. PMID: 15840818 Free PMC article. - Positioning of pyrimidine motifs around cassette exons defines their PTB-dependent splicing in Arabidopsis.
Burgardt R, Lambert D, Heuwieser C, Sack M, Wagner G, Weinberg Z, Wachter A. Burgardt R, et al. Plant J. 2024 Jun;118(6):2202-2218. doi: 10.1111/tpj.16739. Epub 2024 Apr 5. Plant J. 2024. PMID: 38578875 - Regulation of alternative splicing by PTB and associated factors.
Spellman R, Rideau A, Matlin A, Gooding C, Robinson F, McGlincy N, Grellscheid SN, Southby J, Wollerton M, Smith CW. Spellman R, et al. Biochem Soc Trans. 2005 Jun;33(Pt 3):457-60. doi: 10.1042/BST0330457. Biochem Soc Trans. 2005. PMID: 15916540 Review. - Splicing regulation and dysregulation of cholinergic genes expressed at the neuromuscular junction.
Ohno K, Rahman MA, Nazim M, Nasrin F, Lin Y, Takeda JI, Masuda A. Ohno K, et al. J Neurochem. 2017 Aug;142 Suppl 2:64-72. doi: 10.1111/jnc.13954. Epub 2017 Mar 21. J Neurochem. 2017. PMID: 28072465 Review.
Cited by
- Messenger RNA processing is altered in autosomal dominant leukodystrophy.
Bartoletti-Stella A, Gasparini L, Giacomini C, Corrado P, Terlizzi R, Giorgio E, Magini P, Seri M, Baruzzi A, Parchi P, Brusco A, Cortelli P, Capellari S. Bartoletti-Stella A, et al. Hum Mol Genet. 2015 May 15;24(10):2746-56. doi: 10.1093/hmg/ddv034. Epub 2015 Jan 30. Hum Mol Genet. 2015. PMID: 25637521 Free PMC article. - Position-dependent and neuron-specific splicing regulation by the CELF family RNA-binding protein UNC-75 in Caenorhabditis elegans.
Kuroyanagi H, Watanabe Y, Suzuki Y, Hagiwara M. Kuroyanagi H, et al. Nucleic Acids Res. 2013 Apr;41(7):4015-25. doi: 10.1093/nar/gkt097. Epub 2013 Feb 14. Nucleic Acids Res. 2013. PMID: 23416545 Free PMC article. - PAIP1 binds to pre-mRNA and regulates alternative splicing of cancer pathway genes including VEGFA.
Zheng J, Zhang X, Xue Y, Shao W, Wei Y, Mi S, Yang X, Hu L, Zhang Y, Liang M. Zheng J, et al. BMC Genomics. 2024 Oct 3;25(1):926. doi: 10.1186/s12864-024-10530-9. BMC Genomics. 2024. PMID: 39363305 Free PMC article. - Profiling of RNA-binding protein binding sites by in situ reverse transcription-based sequencing.
Xiao Y, Chen YM, Zou Z, Ye C, Dou X, Wu J, Liu C, Liu S, Yan H, Wang P, Zeng TB, Liu Q, Fei J, Tang W, He C. Xiao Y, et al. Nat Methods. 2024 Feb;21(2):247-258. doi: 10.1038/s41592-023-02146-w. Epub 2024 Jan 10. Nat Methods. 2024. PMID: 38200227 Free PMC article. - Promoter activity of polypyrimidine tract-binding protein genes of potato responds to environmental cues.
Butler NM, Hannapel DJ. Butler NM, et al. Planta. 2012 Dec;236(6):1747-55. doi: 10.1007/s00425-012-1726-7. Epub 2012 Aug 7. Planta. 2012. PMID: 22868575
References
- Black DL. Mechanisms of alternative pre-messenger RNA splicing. Annu Rev Biochem. 2003;72:291–336. - PubMed
Publication types
MeSH terms
Substances
Grants and funding
- HG004659/HG/NHGRI NIH HHS/United States
- R01 GM084317/GM/NIGMS NIH HHS/United States
- R01 GM084317-01A1/GM/NIGMS NIH HHS/United States
- GM084317/GM/NIGMS NIH HHS/United States
- R01 HG004659/HG/NHGRI NIH HHS/United States
- GM049369/GM/NIGMS NIH HHS/United States
- R01 GM049369/GM/NIGMS NIH HHS/United States
LinkOut - more resources
Full Text Sources
Other Literature Sources


