Neogenin inhibits HJV secretion and regulates BMP-induced hepcidin expression and iron homeostasis - PubMed (original) (raw)
Neogenin inhibits HJV secretion and regulates BMP-induced hepcidin expression and iron homeostasis
Dae-Hoon Lee et al. Blood. 2010.
Erratum in
- Blood. 2010 Jul 8;116(1):151. Lee, Dai-Hoon [corrected to Lee, Dae-Hoon]; Zhou, Li-Juau [corrected to Zhou, Li-Juan]; Xie, Jiau-Xiu [corrected to Xie, Jian-Xin]
Abstract
Neogenin, a deleted in colorectal cancer (DCC) family member, has been identified as a receptor for the neuronal axon guidance cues netrins and repulsive guidance molecules repulsive guidance molecules (RGM). RGMc, also called hemojuvelin (HJV), is essential for iron homeostasis. Here we provide evidence that neogenin plays a critical role in iron homeostasis by regulation of HJV secretion and bone morphogenetic protein (BMP) signaling. Livers of neogenin mutant mice exhibit iron overload, low levels of hepcidin, and reduced BMP signaling. Mutant hepatocytes in vitro show impaired BMP2 induction of Smad1/5/8 phosphorylation and hepcidin expression. Neogenin is expressed in liver cells in a reciprocal pattern to that of hepcidin, suggesting that neogenin functions in a cell nonautonomous manner. Further studies demonstrate that neogenin may stabilize HJV, a glycosylphosphatidylinositol-anchored protein that interacts with neogenin and suppresses its secretion. Taken together, our results lead the hypothesis that neogenin regulates iron homeostasis via inhibiting secretion of HJV, an inhibitor of BMP signaling, to enhance BMP signaling and hepcidin expression. These results reveal a novel mechanism underlying neogenin regulation of HJV-BMP signaling.
Figures
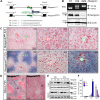
Figure 1
Iron accumulation in periportal hepatocytes of neogenin mutant mice. (A) Diagram of the retrotranspon insertion in neogenin gene. Exons 7 and 8, surrounding intron, and location of genotyping primers are shown diagrammatically. Primer sequences are also indicated. (B) Genotyping and decreased neogenin expression in neogenin mutant mice. Livers of indicated genotype were lysed and resulting lysates were subjected to immunoblotting with anti-neogenin antibody. The top panel shows PCR genotyping. The 327-bp fragment was detected in homozygous mice where the 169-bp fragments in wild-type mice. (C-D) Histologic detection of iron content on cryostat sections of liver (C) and spleen (D) of wild-type and neogenin mutant (neogeninm/m) mice. Five different wild-type and mutant mice were examined, and representative images imaged by Axiophot microscope (Zeiss) and processed using Adobe Photoshop CS2 software are shown. Note iron accumulation was observed in the periportal (portal tract [PT]), but not central vein (CV), regions of P25-old neogeninm/m mice and absence thereof in the red pulp of the spleen. (E) Western blot analysis of liver and spleen lysates from indicated genotype with anti-ferritin-H antibodies. Molecular weights are indicated. (F) Quantitative determination of iron content (μmol/g dry weight; see “Tissue iron staining and quantification”) in various organs of P25-old wild-type (white), neogenin+/m (purple), and neogeninm/m (blue) mice. Means ± SEM of 5 samples for each group were presented. **,#Significant changes (P < .01) in neogeninm/m mice compared with the wild-type control.
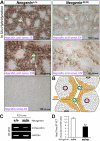
Figure 2
Reduced hepcidin expression in periportal hepatocytes of neogenin mutant liver. (A) In situ hybridization analysis of hepcidin expression in wild-type and neogenin mutant liver at age P25. The experiments were repeated 3 times, and representative images are shown. Note that only antisense, but not sense, probes showed signals, demonstrating the specificity. Central veins (CV) and portal tract (PT) are indicated. (B) Illustration of the “zonal distribution” of hepcidin transcripts in mouse liver. Hepcidin transcripts were detected mainly in periportal hepatocytes, labeled by yellow color. RT-PCR (C) and real-time PCR (D) analyses of hepcidin expression in neogenin+/+ and neogeninm/m livers (P25). Means ± SEM of 3 samples for each group are shown. **Significant difference (P < .01) from the wild-type control.
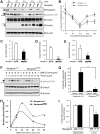
Figure 3
Reduction of BMP signaling and hepcidin expression in neogenin mutant livers and in mutant hepatocyte culture. (A) Western blot analyses of liver lysates derived from wild-type (+/+) and neogenin mutant (m/m) mice during development using indicated antibodies; P3 indicates postnatal day 3. Note that the up-regulation of pSmad1/5/8 after P12 was blocked in neogenin mutant mice. (B) Quantification analysis of data from panel A. Three different mice from each age group were analyzed. Mean ± SEM is shown (n = 3). *P < .01, significant difference from the wild-type control. (C-E) Real-time PCR analysis of the expression of Id1, Smad7, and Atoh8 in wild-type and neogenin mutant livers. The expression was normalized to the reference gene NADPH mRNA. Mean ± SEM shown (n = 3). *P < .01, significant difference from the wild-type control. (F) Western blot analysis of lysates of primary cultured hepatocytes derived from wild-type and neogeninm/m mice. Primary hepatocytes cultured for 5 days were treated with BMP2 (100 ng/mL) for the indicated times. Equal amounts of total proteins were immunoblotted with the indicated antibodies. (G) Quantitative analysis of data from panel A. Mean value was shown, which was from 2 independent experiments. (H-I) Real-time RT-PCR analysis of BMP2 induced (H) and basal (I) hepcidin expression in primary hepatocytes and in livers (D) derived from wild-type and neogenin mutant mice. Primary hepatocytes isolated from perfused livers of wild-type (C57BL/6) and neogenin mutant mice were cultured in collagen coated 12-well plates for 2 hours and treated with BMP2 (100 ng/mL) for 15 hours. The expression of hepcidin and NADPH (as a normalization gene) was assayed by quantitative real-time RT-PCR using TagMan probes. All samples were processed in triplicate, and a graph of mean values ± SEM from 3 independent experiments is shown. *P < .01, significant difference from wild-type control (t test).
Figure 4
Neogenin expression in mouse liver. (A) Detection of enzymatic lacZ activity in livers from P25-old neogeninm/m mice. (B) Illustration of zonal distribution of neogenin protein in hepatocytes close to central veins and nonhepatocytes align with portal vein (green color). (C) Immunohistochemical detection of neogenin in livers from P25 neogenin+/+ and neogeninm/m mice. (D) Confocal images of coimmunohistochemical analysis in liver sections of P25 wild-type mouse using antibodies against neogenin (polyclonal, red) and GS (monoclonal, green). Arrows point to neogenin-expressing hepatocytes. CV indicates central vein; and PT, portal tract. Bars represent 100 μm. In panels A, C, and D, 3 to 5 different mice for each indicated group were examined, and representative images are shown.
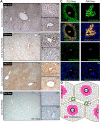
Figure 5
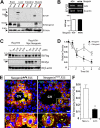
HJV/RGMc expression in mouse liver. (A-B) In situ hybridization analysis of HJV mRNA expression in mouse (C57BL/6) livers at different age. Note that only antisense (A), but not sense (B), HJV probes showed signals, demonstrating the specificity. (C) Confocal images of coimmunohistochemical detection of both HJV and GS, a marker of hepatocytes surrounding pericentral regions, in liver sections of P25 wild-type mouse. Arrows point to HJV-expressing hepatocytes. Central veins (CVs) and portal tract (PT) are indicated; bars represent 100 μm[b]. (D) Illustration of HJV “zonal distribution” pattern (pink color). In panels A through C, 3 different wild-type mice for indicated age were examined, and representative images are shown.
Figure 6
Reduced HJV protein level and altered HJV cellular distribution in neogenin mutant mice. (A) Western blot analysis of HJV protein in different tissue lysates derived from P25 neogenin+/+ and neogeninm/m mice. (B) RT-PCR analysis to assess expression of transcripts for HJV from P20 muscles of neogenin+/+ and neogeninm/m mice. (C-D) Neogenin increases HJV protein level/stability. HEK293 cells were transfected Flag-HJV with or without neogenin. Cells were treated with CHX (an inhibitor of protein synthesis; 100 μg/mL) for indicated times. Lysates were probed with indicated antibodies. Blots were scanned with an Epson scanner and analyzed by National Institutes of Health ImageJ software. Quantitative analysis is shown in panel D. (E) Confocal images of coimmunohistochemical staining analysis of HJV protein distribution in wild-type and neogenin mutant liver at P25. Samples from 3 different mice were examined, and representative images examined by confocal microscope (Zeiss LSM 510 META, 40×/1.00 oil DIC) and processed using Adobe Photoshop CS2 software are shown. HJV (rabbit polyclonal, green), GS (monoclonal, red), and Topro3 (to label nuclei, blue) are indicated. The boxed areas were magnified and are shown in the bottom panels. The scale bars represent 100 μm. (F) Quantification analysis of data from panel E. The HJV immunoflourescence intensity per GS-positive cell is presented as means ± SEM (10 images from 3 different animals). *P < .01 compared with the wild-type liver.
Figure 7
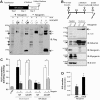
Neogenin inhibition of HJV secretion. (A-B) Neogenin inhibition of HJV secretion in serum-starved culture. Transfected HEK293 cells were cultured in the presence of 0.5% of serum and the cell lysates and medium were subjected to Western analysis (A). The HJV secretion in the collected medium was also measured by ELISA analysis (B). The mean ± SEM of HJV secretion (binding to the antibodies) was presented. *P < .01, significant difference from the HJV expression alone. (C) Illustration of P15 muscle culture and Western blot analysis of cell lysates and medium from wild-type and neogenin mutant muscle culture with indicated antibodies. Note that HJV was increased in the medium, but reduced in cell lysates, of neogenin mutant culture. (D) Quantification analysis of data from panel C. The data were quantified by National Institutes of Health ImageJ program from 3 different blots and presented as means ± SD. *P < .01, significant difference from the wild-type control.
Figure 8
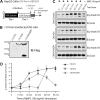
Inhibition of BMP2 induced Smad1/5/8 phosphorylation by secreted HJV. HepG2 cells were serum-starved for 1 day, preincubated with condition medium (CM) collected from HEK293 cells transfected with indicated plasmids, and then treated with BMP2 (100 ng/mL) for various times (A). CM containing secreted HJV or HJVΔGPI mutant was revealed by Western blot analysis (B). BMP2-induced Smad1/5/8 phosphorylation in HepG2 cells was analyzed by Western blot analysis as shown in panel C. (D) Quantification analysis of data from panel C. Data were quantified by National Institutes of Health ImageJ program from 3 different experiments. Means ± SD are presented.
Similar articles
- Neogenin Facilitates the Induction of Hepcidin Expression by Hemojuvelin in the Liver.
Zhao N, Maxson JE, Zhang RH, Wahedi M, Enns CA, Zhang AS. Zhao N, et al. J Biol Chem. 2016 Jun 3;291(23):12322-35. doi: 10.1074/jbc.M116.721191. Epub 2016 Apr 12. J Biol Chem. 2016. PMID: 27072365 Free PMC article. - Evidence that inhibition of hemojuvelin shedding in response to iron is mediated through neogenin.
Zhang AS, Anderson SA, Meyers KR, Hernandez C, Eisenstein RS, Enns CA. Zhang AS, et al. J Biol Chem. 2007 Apr 27;282(17):12547-56. doi: 10.1074/jbc.M608788200. Epub 2007 Mar 1. J Biol Chem. 2007. PMID: 17331953 - Hemojuvelin-neogenin interaction is required for bone morphogenic protein-4-induced hepcidin expression.
Zhang AS, Yang F, Wang J, Tsukamoto H, Enns CA. Zhang AS, et al. J Biol Chem. 2009 Aug 21;284(34):22580-9. doi: 10.1074/jbc.M109.027318. Epub 2009 Jun 29. J Biol Chem. 2009. PMID: 19564337 Free PMC article. - Hemojuvelin: the hepcidin story continues.
Malyszko J. Malyszko J. Kidney Blood Press Res. 2009;32(2):71-6. doi: 10.1159/000208988. Epub 2009 Mar 14. Kidney Blood Press Res. 2009. PMID: 19287179 Review. - Regulation of hepcidin and iron-overload disease.
Lee PL, Beutler E. Lee PL, et al. Annu Rev Pathol. 2009;4:489-515. doi: 10.1146/annurev.pathol.4.110807.092205. Annu Rev Pathol. 2009. PMID: 19400694 Review.
Cited by
- Neogenin in Amygdala for Neuronal Activity and Information Processing.
Sun XD, Chen WB, Sun D, Huang J, Li YQ, Pan JX, Wang YN, Zhao K, Dong ZQ, Wang HS, Xiong L, Xuan A, Zhao ST, Pillai A, Xiong WC, Mei L. Sun XD, et al. J Neurosci. 2018 Oct 31;38(44):9600-9613. doi: 10.1523/JNEUROSCI.0433-18.2018. Epub 2018 Sep 18. J Neurosci. 2018. PMID: 30228230 Free PMC article. - A systems biology approach to iron metabolism.
Chifman J, Laubenbacher R, Torti SV. Chifman J, et al. Adv Exp Med Biol. 2014;844:201-25. doi: 10.1007/978-1-4939-2095-2_10. Adv Exp Med Biol. 2014. PMID: 25480643 Free PMC article. Review. - Hepcidin and iron homeostasis.
Ganz T, Nemeth E. Ganz T, et al. Biochim Biophys Acta. 2012 Sep;1823(9):1434-43. doi: 10.1016/j.bbamcr.2012.01.014. Epub 2012 Jan 26. Biochim Biophys Acta. 2012. PMID: 22306005 Free PMC article. Review. - HFE-Related Hemochromatosis May Be a Primary Kupffer Cell Disease.
Kouroumalis E, Tsomidis I, Voumvouraki A. Kouroumalis E, et al. Biomedicines. 2025 Mar 10;13(3):683. doi: 10.3390/biomedicines13030683. Biomedicines. 2025. PMID: 40149659 Free PMC article. Review. - Coordination of iron homeostasis by bone morphogenetic proteins: Current understanding and unanswered questions.
Fisher AL, Babitt JL. Fisher AL, et al. Dev Dyn. 2022 Jan;251(1):26-46. doi: 10.1002/dvdy.372. Epub 2021 May 25. Dev Dyn. 2022. PMID: 33993583 Free PMC article.
References
- Swinkels DW, Janssen MC, Bergmans J, Marx JJ. Hereditary hemochromatosis: genetic complexity and new diagnostic approaches. Clin Chem. 2006;52(6):950–968. - PubMed
- Monnier PP, Sierra A, Macchi P, et al. RGM is a repulsive guidance molecule for retinal axons. Nature. 2002;419(6905):392–395. - PubMed
- Schmidtmer J, Engelkamp D. Isolation and expression pattern of three mouse homologues of chick Rgm. Gene Expr Patterns. 2004;4(1):105–110. - PubMed
Publication types
MeSH terms
Substances
LinkOut - more resources
Full Text Sources
Other Literature Sources
Medical
Molecular Biology Databases
