FOXM1 confers acquired cisplatin resistance in breast cancer cells - PubMed (original) (raw)
FOXM1 confers acquired cisplatin resistance in breast cancer cells
Jimmy M-M Kwok et al. Mol Cancer Res. 2010 Jan.
Abstract
The transcription factor Forkhead box M1 (FOXM1) is a key regulator of cell proliferation and is overexpressed in many forms of primary cancers, leading to uncontrolled cell division and genomic instability. To address the role of FOXM1 in chemoresistance, we generated a cisplatin-resistant breast cancer cell line (MCF-7-CIS(R)), which had an elevated level of FOXM1 protein and mRNA expression relative to the parental MCF-7 cells. A close correlation was observed between FOXM1 and the expression of its proposed downstream targets that are involved in DNA repair; breast cancer-associated gene 2 (BRCA2) and X-ray cross-complementing group 1 (XRCC1) were expressed at higher levels in the resistant cell lines compared with the sensitive MCF-7 cells. Moreover, cisplatin treatment induced DNA damage repair in MCF-7-CIS(R) and not in MCF-7 cells. Furthermore, the expression of a constitutively active FOXM1 (DeltaN-FOXM1) in MCF-7 cells alone was sufficient to confer cisplatin resistance. Crucially, the impairment of DNA damage repair pathways through the small interfering RNA knockdown inhibition of either FOXM1 or BRCA2/XRCC1 showed that only the silencing of FOXM1 could significantly reduce the rate of proliferation in response to cisplatin treatment in the resistant cells. This suggests that the targeting of FOXM1 is a viable strategy in circumventing acquired cisplatin resistance. Consistently, the FOXM1 inhibitor thiostrepton also showed efficacy in causing cell death and proliferative arrest in the cisplatin-resistant cells through the downregulation of FOXM1 expression. Taken together, we have identified a novel mechanism of acquired cisplatin resistance in breast cancer cells through the induction of FOXM1.
Figures
Figure 1. Cisplatin resistant cell line shows elevated FOXM1 protein and mRNA expression levels
A) MCF-7 and MCF-7-CISR cells were treated with increasing concentrations of cisplatin and their rates of proliferation measured by SRB assay. B) Western blot analysis determining the relative protein expression levels of FOXM1, BRCA2 and XRCC1 in MCF-10A, MCF-7 and MCF-7-CISR cells. C) FOXM1 protein expression level was quantified using ImageJ normalized against tubulin levels. D) FOXM1 mRNA transcript levels were being determined by RTQ-PCR analysis. Results shown were derived from at least three independent experiments. The error bars show the standard deviation (mean ± SD). Statistical analysis was performed using Student’s t tests. **, P ≤ 0.01, significant.
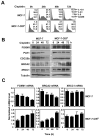
Figure 2. Elevated levels of FOXM1 correlate with enhanced DNA damage repair in MCF-7-CISR cells
A) MCF-7 and MCF-7-CISR cells were treated with 0.1 μM of cisplatin for 0 to 72 h and FACS analysis was performed after propidium iodide staining. Percentage of cells in each phase of the cell cycle (sub-G1, G1, S, and G2/M) is indicated. Representative data from three independent experiments are shown. B) MCF-7 and MCF-7-CISR cells were treated with 0.1 μM of cisplatin and western blot analysis was performed to determine the protein expression levels of FOXM1, CDC25B, PLK1, BRCA2, XRCC1 and β-tubulin. C) FOXM1, BRCA2 and XRCC1 mRNA transcript levels were determined by RTQ-PCR and normalized to L19 RNA expression. Results of three independent experiments in triplicate and means ± SD are shown.
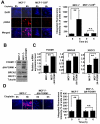
Figure 3. Overexpression of ΔN-FOXM1 is sufficient to confer cisplatin resistance by enhancing DNA repair pathways in reducing DNA damage
A) MCF-7 and MCF-7-CISR cells were treated with 0.1 μM of cisplatin for 0h or 6h and stained with γH2AX antibodies and DAPI. Images were visualized by confocal microscopy and the average integrated fluorescence intensity quantified by Zeiss Axiovert 100 confocal laser scanning microscope using Zeiss LSM 500 software. Images: original magnification X 40. The relative expression levels of FOXM1, BRCA2 and XRCC1 in MCF-7 and MCF-7-ΔN-FOXM1 were determined by B) Western blotting and C) RTQ-PCR analysis, respectively. D) MCF-7 and MCF-7-ΔN-FOXM1 cells were treated with 0.1 μM of cisplatin for 0h or 6h and stained with γH2AX antibodies and DAPI. Images visualized by confocal microscopy; the average integrated fluorescence intensities are shown. Original magnification X 40. The average results of three independent experiments in triplicates are shown. Mean ± SD. Statistical analyses were performed using Student’s t tests. *, P ≤ 0.05; **, P ≤ 0.01 significant.
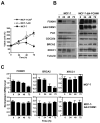
Figure 4. Overexpression of ΔN-FOXM1 is sufficient confer cisplatin resistance by enhancing DNA repair pathways in reducing DNA damage
MCF-7 and MCF-7-ΔN-FOXM1 cells were treated with 0.1 μM of cisplatin for 0, 24, 48 and 72 h. A) Cell proliferation rates were determined by SRB assays, and MCF-7-CISR cells were also included as a control for cisplatin-resistant cells.The relative expression levels of FOXM1, BRCA2 and XRCC1 in MCF-7 and MCF-7-ΔN-FOXM1 cells were determined by B) Western blotting C) RTQ-PCR analysis. The expression levels of CDC25B and PLK1 proteins were also studied for comparison. RTQ-PCR results and means ± SD shown are from three independent experiments in triplicates.
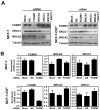
Figure 5. BRCA2 and XRCC1 are not the sole downstream targets of FOXM1 involved in cisplatin resistance
MCF-7 and MCF-7-CISR cells were either untransfected (Mock), transfected with non-specific (NS) siRNA (100 nM) or siRNA smart pool against FOXM1 (100 nM), BRCA2 (100 nM), XRCC1 (100 nM) or BRCA2 plus XRCC1 (100 nM) for 24 h. A) The expression levels of FOXM1, BRCA2 and XRCC1 in MCF-7 and MCF-7-CISR cells were determined by Western blotting. B) RTQ-PCR analysis was performed to determine the relative FOXM1, BRCA2 and XRCC1 mRNA transcript levels. C) MCF-7-CISR cells were then treated with 0.1 μM of cisplatin for either 0h or 6h, and stained with γH2AX antibodies and DAPI. Images visualized by confocal microscopy and the average integrated fluorescence intensity is shown. Original magnification X 40. D) SRB assay was performed to gauge the changes in percentage in cell proliferation in the presence and absence of cisplatin treatment in MCF-7-CISR cells with different siRNA knockdown conditions. Cell proliferation results shown compared the proliferative rates of cisplatin-treated cells with the untreated cells of a given siRNA transfection. Data shown were derived from at least three independent experiments. The error bars show the standard deviation (mean ± SD). Statistical analysis was done using Student’s t tests. *, P ≤ 0.05; **, P ≤ 0.01, significant.
Figure 6. Thiostrepton can overcome cisplatin resistance in MCF-7-CISR breast cancer cells
MCF-7-CISR cells were treated with DMSO (vehicle control), 0.1μM cisplatin, 10 μM thiostrepton or a combination of 0.1 μM cisplatin and 10 μM thiostrepton for 72 h. A) SRB proliferation assays were performed on these cells and the percentage of viable cells at each time point is shown. B) Cells were fixed at 0, 24, 48, and 72 h after treatment, and cell cycle phase distribution was analyzed by flow cytometry after propidium iodide staining. Percentage of cells in each phase of the cell cycle (sub-G1, G1, S, and G2/M) is indicated. Representative data from three independent experiments are shown. C) Cell lysates were prepared at the times indicated, and the expression of FOXM1, CDC25B, XRCC1, BRCA2, and β-tubulin analyzed by Western blotting.
Similar articles
- FOXM1: an emerging master regulator of DNA damage response and genotoxic agent resistance.
Zona S, Bella L, Burton MJ, Nestal de Moraes G, Lam EW. Zona S, et al. Biochim Biophys Acta. 2014 Nov;1839(11):1316-22. doi: 10.1016/j.bbagrm.2014.09.016. Epub 2014 Oct 5. Biochim Biophys Acta. 2014. PMID: 25287128 Free PMC article. Review. - Thiostrepton selectively targets breast cancer cells through inhibition of forkhead box M1 expression.
Kwok JM, Myatt SS, Marson CM, Coombes RC, Constantinidou D, Lam EW. Kwok JM, et al. Mol Cancer Ther. 2008 Jul;7(7):2022-32. doi: 10.1158/1535-7163.MCT-08-0188. Mol Cancer Ther. 2008. PMID: 18645012 - Gefitinib (Iressa) represses FOXM1 expression via FOXO3a in breast cancer.
McGovern UB, Francis RE, Peck B, Guest SK, Wang J, Myatt SS, Krol J, Kwok JM, Polychronis A, Coombes RC, Lam EW. McGovern UB, et al. Mol Cancer Ther. 2009 Mar;8(3):582-91. doi: 10.1158/1535-7163.MCT-08-0805. Epub 2009 Mar 10. Mol Cancer Ther. 2009. PMID: 19276163 - OTUB1 inhibits the ubiquitination and degradation of FOXM1 in breast cancer and epirubicin resistance.
Karunarathna U, Kongsema M, Zona S, Gong C, Cabrera E, Gomes AR, Man EP, Khongkow P, Tsang JW, Khoo US, Medema RH, Freire R, Lam EW. Karunarathna U, et al. Oncogene. 2016 Mar 17;35(11):1433-44. doi: 10.1038/onc.2015.208. Epub 2015 Jul 6. Oncogene. 2016. PMID: 26148240 Free PMC article. - Insights into a Critical Role of the FOXO3a-FOXM1 Axis in DNA Damage Response and Genotoxic Drug Resistance.
Nestal de Moraes G, Bella L, Zona S, Burton MJ, Lam EW. Nestal de Moraes G, et al. Curr Drug Targets. 2016;17(2):164-77. doi: 10.2174/1389450115666141122211549. Curr Drug Targets. 2016. PMID: 25418858 Free PMC article. Review.
Cited by
- BRCA1-like signature in triple negative breast cancer: Molecular and clinical characterization reveals subgroups with therapeutic potential.
Severson TM, Peeters J, Majewski I, Michaut M, Bosma A, Schouten PC, Chin SF, Pereira B, Goldgraben MA, Bismeijer T, Kluin RJ, Muris JJ, Jirström K, Kerkhoven RM, Wessels L, Caldas C, Bernards R, Simon IM, Linn S. Severson TM, et al. Mol Oncol. 2015 Oct;9(8):1528-38. doi: 10.1016/j.molonc.2015.04.011. Epub 2015 May 7. Mol Oncol. 2015. PMID: 26004083 Free PMC article. - FOXM1 mediates Dox resistance in breast cancer by enhancing DNA repair.
Park YY, Jung SY, Jennings NB, Rodriguez-Aguayo C, Peng G, Lee SR, Kim SB, Kim K, Leem SH, Lin SY, Lopez-Berestein G, Sood AK, Lee JS. Park YY, et al. Carcinogenesis. 2012 Oct;33(10):1843-53. doi: 10.1093/carcin/bgs167. Epub 2012 May 10. Carcinogenesis. 2012. PMID: 22581827 Free PMC article. - Peroxiredoxin 3 is a redox-dependent target of thiostrepton in malignant mesothelioma cells.
Newick K, Cunniff B, Preston K, Held P, Arbiser J, Pass H, Mossman B, Shukla A, Heintz N. Newick K, et al. PLoS One. 2012;7(6):e39404. doi: 10.1371/journal.pone.0039404. Epub 2012 Jun 25. PLoS One. 2012. PMID: 22761781 Free PMC article. - Increased FOXM1 expression can stimulate DNA repair in normal hepatocytes in vivo but also increases nuclear foci associated with senescence.
Baranski OA, Kalinichenko VV, Adami GR. Baranski OA, et al. Cell Prolif. 2015 Feb;48(1):105-15. doi: 10.1111/cpr.12153. Epub 2014 Dec 5. Cell Prolif. 2015. PMID: 25477198 Free PMC article. - FOXM1: an emerging master regulator of DNA damage response and genotoxic agent resistance.
Zona S, Bella L, Burton MJ, Nestal de Moraes G, Lam EW. Zona S, et al. Biochim Biophys Acta. 2014 Nov;1839(11):1316-22. doi: 10.1016/j.bbagrm.2014.09.016. Epub 2014 Oct 5. Biochim Biophys Acta. 2014. PMID: 25287128 Free PMC article. Review.
References
- Kelland L. The resurgence of platinum-based cancer chemotherapy. Nat Rev Cancer. 2007;7:573–84. - PubMed
- Siddik ZH. Cisplatin: mode of cytotoxic action and molecular basis of resistance. Oncogene. 2003;22:7265–79. - PubMed
- Chang IY, Kim MH, Kim HB, et al. Small interfering RNA-induced suppression of ERCC1 enhances sensitivity of human cancer cells to cisplatin. Biochem Biophys Res Commun. 2005;327:225–33. - PubMed
- Dabholkar M, Bostick-Bruton F, Weber C, Bohr VA, Egwuagu C, Reed E. ERCC1 and ERCC2 expression in malignant tissues from ovarian cancer patients. J Natl Cancer Inst. 1992;84:1512–7. - PubMed
- Ferry KV, Hamilton TC, Johnson SW. Increased nucleotide excision repair in cisplatin-resistant ovarian cancer cells: role of ERCC1-XPF. Biochem Pharmacol. 2000;60:1305–13. - PubMed
Publication types
MeSH terms
Substances
Grants and funding
- 2007NOVPHD16/BCN_/Breast Cancer Now/United Kingdom
- BB_/Biotechnology and Biological Sciences Research Council/United Kingdom
- MRC_/Medical Research Council/United Kingdom
- 12011/CRUK_/Cancer Research UK/United Kingdom
- A5610/CRUK_/Cancer Research UK/United Kingdom
- A5606/CRUK_/Cancer Research UK/United Kingdom
LinkOut - more resources
Full Text Sources
Other Literature Sources
Medical
Miscellaneous


