Direct transfer of alpha-synuclein from neuron to astroglia causes inflammatory responses in synucleinopathies - PubMed (original) (raw)
Direct transfer of alpha-synuclein from neuron to astroglia causes inflammatory responses in synucleinopathies
He-Jin Lee et al. J Biol Chem. 2010.
Abstract
Abnormal neuronal aggregation of alpha-synuclein is implicated in the development of many neurological disorders, including Parkinson disease and dementia with Lewy bodies. Glial cells also show extensive alpha-synuclein pathology and may contribute to disease progression. However, the mechanism that produces the glial alpha-synuclein pathology and the interaction between neurons and glia in the disease-inflicted microenvironment remain unknown. Here, we show that alpha-synuclein proteins released from neuronal cells are taken up by astrocytes through endocytosis and form inclusion bodies. The glial accumulation of alpha-synuclein through the transmission of the neuronal protein was also demonstrated in a transgenic mouse model expressing human alpha-synuclein. Furthermore, astrocytes that were exposed to neuronal alpha-synuclein underwent changes in the gene expression profile reflecting an inflammatory response. Induction of pro-inflammatory cytokines and chemokines correlated with the extent of glial accumulation of alpha-synuclein. Together, these results suggest that astroglial alpha-synuclein pathology is produced by direct transmission of neuronal alpha-synuclein aggregates, causing inflammatory responses. This transmission step is thus an important mediator of pathogenic glial responses and could qualify as a new therapeutic target.
Figures
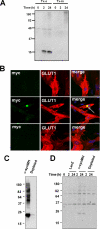
FIGURE 1.
Uptake of neuronal cell-derived α-synuclein from conditioned medium by astrocytes. A, Western analysis of α-synuclein uptake in primary astrocytes. α-Synuclein-containing conditioned medium was obtained from SH-SY5Y culture and added to the primary astrocytes for the indicated times. Tx-s, Triton X-100-soluble; Tx-in, Triton X-100-insoluble. B, immunofluorescence staining of primary astrocytes (GLUT1-positive) treated with the conditioned media used in C. Top panels: LacZ medium. Middle panels: Myc-His-tagged α-synuclein (α_-synMH_) medium. Bottom panels: depleted medium. A perinuclear inclusion body produced by the internalized α-synuclein is indicated by an arrow in the middle panel. Scale bars: 20 μm. Experiments were repeated three times. C, depletion of α-synMH from the conditioned medium of differentiated SH-SY5Y cells expressing α-synMH. D, uptake of neuronal cell-derived α-synuclein by astrocytes. Conditioned media from LacZ- or α-synMH-expressing cells, or the latter with α-synMH depleted were incubated with rat astrocytes for the indicated times. Note that both monomeric and aggregated forms (represented by the smear between the 37- and 180-kDa markers) of α-synuclein were taken up from the α-synMH medium.
FIGURE 2.
Cell-to-cell transmission of α-synuclein to primary astrocytes in co-culture. A and B, primary astrocytes were co-cultured with differentiated SH-SY5Y cells overexpressing α-synuclein. Serial images through z axis were obtained and analyzed to show that transmitted α-synuclein (green) reside inside of astrocytes (red: GFAP). Areas in the white boxes are enlarged (left panels, xy images; right panels, z-stacked images seen through the y axis). C, transfer of neuronal endogenous α-synuclein to astrocytes. Rat primary cortical neurons were co-cultured with astrocytes. Note that the α-synuclein polyclonal antibody used in this experiment also recognizes rat sequences. Top panels: primary astrocytes cultured with neurons. Bottom panels: primary astrocytes only. White perforated lines indicate outlines of astrocyte periphery. D, primary astrocytes were cultured with differentiated SH-SY5Y cells overexpressing α-synuclein and fixed at the indicated times. The control indicates a co-culture with SH-SY5Y cells without α-synuclein overexpression. Arrows: perinuclear inclusions. E, quantitative analyses of α-synuclein transfer (left graph) and glial inclusion formation (right graph). Differentiated SH-SY5Y cells overexpressing human α-synuclein were co-cultured with rat primary astrocytes. The transfer was measured by fluorescence intensities of α-synuclein staining in astrocytes, and the inclusion formation was measured by the percentage of astrocytes with inclusions among the cells with transferred α-synuclein. Experiments were repeated four times, and more than hundred cells were counted per slide. All scale bars, 20 μm (*, p < 0.05; **, p < 0.01; ***, p < 0.001).
FIGURE 3.
Characterization of astroglial α-synuclein inclusions. A–D, inclusion bodies in co-cultured primary astrocytes were stained with thioflavin S (A) or with antibodies for ubiquitin (B), Hsp70/Hsc70 (C), and 20 S proteasome α-subunit (D). Inclusion bodies that are positive for the markers are indicated with arrowheads, and the ones negative are marked with arrows. Scale bars, 20 μm. E, quantitative analysis of inclusion bodies for each marker. Experiments were repeated three times, and more than one hundred cells were counted per slide.
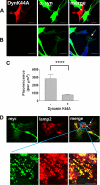
FIGURE 4.
Endocytosis-dependent transfer of α-synuclein to primary astrocytes. A–C, effects of dynamin-1 K44A mutant. Primary astrocytes were transfected with a dominant negative K44A mutant of dynamin-1 and co-cultured with α-synuclein-expressing SH-SY5Y cells. The images in A show an example of astrocyte expressing dynamin K44A with little α-synuclein transfer. The images in B show an astrocyte on the same coverslip without dynamin K44A expression, but with transferred α-synuclein (arrow). The graph in C shows quantitative analysis of the transferred α-synuclein fluorescence in K44A-expressing (+) or untransfected (−) astrocytes. Error bars represent S.E. (****, p < 0.0001). D, co-staining of the transferred α-synuclein with the late endosomal/lysosomal marker Lamp-2 in astrocytes in co-culture. Arrows indicate the co-staining of α-synuclein and Lamp-2. The bottom images are the enlarged views of the blue rectangle area in the upper images. Scale bars, 20 μm. Experiments were repeated four times, and more than one hundred cells were counted per slide.
FIGURE 5.
In vivo evidence for neuron-to-glia transmission of α-synuclein in tg models. A, immunocytochemical distribution of α-synuclein in the neocortical deeper layers in non-tg control, PDGF-APP tg, PDGFα-syn tg, PDGFα-syn-GFP, and β-syn tg. In the APP tg mice α-synuclein immunoreactivity is localized in dystrophic neurites around the plaque (arrow), whereas in the PDGFα-syn tg, α-synuclein accumulates both in neuronal (arrows) and glial cells (*). No glial accumulation of α-synuclein was detected in PDGFα-syn-GFP and β-syn tg. Experiments were performed in triplicate, and the representative images are shown. B, double labeling and confocal microscopy analysis, showing that, in DLB cases as well as in PDGFα-syn tg mice, glial cells expressing S100 displayed human α-synuclein accumulation (arrows). In contrast, in the PDGFα-syn-GFP tg mice no GFP signal (associated with α-synuclein) was detected in S100-positive cells. At least three independent experiments were performed, and the representative images are shown. C, in situ hybridization for the detection of human α-synuclein mRNA. Human α-synuclein is expressed mostly in neurons (top and middle panels). D, quantification of data represented in B (top panel) and C (bottom panel). For counting of glial cells with accumulated α-synuclein (top panel), PDGFα-syn tg mice (n = 6), PDGFα-syn-GFP mice (n = 4), DLB cases (n = 8), and control cases (n = 6) were analyzed. The graph on the bottom panel presents % cells containing human α-synuclein mRNA. Six mice of each group were analyzed. For each mouse 2 sections were evaluated, and from each section 5 fields, on average, 75–100 cells were counted. White bars, NeuN-positive neurons; black bars, S100-positive astrocytes. Scale bars, 20 μm (**, p < 0.01; ***, p < 0.001).
FIGURE 6.
Gene expression changes in astrocytes exposed to neuronal cell-derived α-synuclein. A, a heatmap showing expression patterns of the identified DEGs at both 6 and 24 h. The colors represent the relative increase (red) and decrease (green) in expression levels of the corresponding genes in primary astrocytes treated with α-synuclein-containing conditioned medium from SH-SY5Y cultures, compared with those treated with the conditioned medium from LacZ-expressing cells. B, a hypothetical protein network constructed with some of the identified DEGs enriched by GOBPs or KEGG pathways. The network node colors represent the increase (red) or the decrease (green) in expression levels of the corresponding genes. The center and border colors of the network node proteins represent the gene expression changes at 6 and 24 h, respectively. The genes selected as DEGs are indicated by bold-italic fonts. The solid and dotted lines represent the direct and indirect protein-protein interactions, respectively. Transcriptional regulations are represented by blue double-dashed lines. The shaded regions represent biological functional modules. C, RT-PCR analysis of the DEGs. Total RNAs were obtained from primary astrocytes treated with the conditioned media from LacZ (cont) or α-synuclein (α_S_)-expressing SH-SY5Y cultures. Glyceraldehyde-3-phosphate dehydrogenase (GAPDH) and β-actin were used as control. Numbers on the right are the sizes of PCR products in base pairs. D, correlation between transmitted α-synuclein and cytokine induction in astrocytes. After immunofluorescence labeling, fluorescence intensities per μm2 of cytokines and transmitted α-synuclein in each individual astrocyte were plotted, and linear regression was used (open circle, IL-1α; blue triangle, IL-1β; and red circle, IL-6).
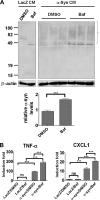
FIGURE 7.
Pro-inflammatory gene induction by glial α-synuclein accumulation. A, accumulation of internalized α-synuclein by lysosomal inhibition. Primary astrocytes were treated with either DMSO or bafilomycin A1 (Baf) and incubated with LacZ or α-synuclein conditioned medium. The Triton-insoluble fractions were analyzed by Western blotting, and α-synuclein accumulation was quantified (graph). Error bars represent ±S.E. Experiments were performed four times. B, cytokine and chemokine production. Astrocytes were treated as in A, and the production of TNFα and CXCL1 was measured in culture media using the multiplex system. Assays were performed in triplicate (***, p < 0.001).
Similar articles
- Alpha-synuclein stimulation of astrocytes: Potential role for neuroinflammation and neuroprotection.
Lee HJ, Kim C, Lee SJ. Lee HJ, et al. Oxid Med Cell Longev. 2010 Jul-Aug;3(4):283-7. doi: 10.4161/oxim.3.4.12809. Oxid Med Cell Longev. 2010. PMID: 20972375 Free PMC article. - Neurons and Glia Interplay in α-Synucleinopathies.
Mavroeidi P, Xilouri M. Mavroeidi P, et al. Int J Mol Sci. 2021 May 8;22(9):4994. doi: 10.3390/ijms22094994. Int J Mol Sci. 2021. PMID: 34066733 Free PMC article. Review. - Antibody-aided clearance of extracellular α-synuclein prevents cell-to-cell aggregate transmission.
Bae EJ, Lee HJ, Rockenstein E, Ho DH, Park EB, Yang NY, Desplats P, Masliah E, Lee SJ. Bae EJ, et al. J Neurosci. 2012 Sep 26;32(39):13454-69. doi: 10.1523/JNEUROSCI.1292-12.2012. J Neurosci. 2012. PMID: 23015436 Free PMC article. - Autophagy modulates SNCA/α-synuclein release, thereby generating a hostile microenvironment.
Poehler AM, Xiang W, Spitzer P, May VE, Meixner H, Rockenstein E, Chutna O, Outeiro TF, Winkler J, Masliah E, Klucken J. Poehler AM, et al. Autophagy. 2014;10(12):2171-92. doi: 10.4161/auto.36436. Autophagy. 2014. PMID: 25484190 Free PMC article. - Glial dysfunction in the pathogenesis of α-synucleinopathies: emerging concepts.
Fellner L, Jellinger KA, Wenning GK, Stefanova N. Fellner L, et al. Acta Neuropathol. 2011 Jun;121(6):675-93. doi: 10.1007/s00401-011-0833-z. Epub 2011 May 12. Acta Neuropathol. 2011. PMID: 21562886 Free PMC article. Review.
Cited by
- Comparison of alpha-synuclein immunoreactivity in the spinal cord between the adult and aged beagle dog.
Ahn JH, Choi JH, Park JH, Yan BC, Kim IH, Lee JC, Lee DH, Kim JS, Shin HC, Won MH. Ahn JH, et al. Lab Anim Res. 2012 Sep;28(3):165-70. doi: 10.5625/lar.2012.28.3.165. Epub 2012 Sep 26. Lab Anim Res. 2012. PMID: 23091516 Free PMC article. - LRRK2 mediates microglial neurotoxicity via NFATc2 in rodent models of synucleinopathies.
Kim C, Beilina A, Smith N, Li Y, Kim M, Kumaran R, Kaganovich A, Mamais A, Adame A, Iba M, Kwon S, Lee WJ, Shin SJ, Rissman RA, You S, Lee SJ, Singleton AB, Cookson MR, Masliah E. Kim C, et al. Sci Transl Med. 2020 Oct 14;12(565):eaay0399. doi: 10.1126/scitranslmed.aay0399. Sci Transl Med. 2020. PMID: 33055242 Free PMC article. - Alpha-synuclein cell-to-cell transfer and seeding in grafted dopaminergic neurons in vivo.
Angot E, Steiner JA, Lema Tomé CM, Ekström P, Mattsson B, Björklund A, Brundin P. Angot E, et al. PLoS One. 2012;7(6):e39465. doi: 10.1371/journal.pone.0039465. Epub 2012 Jun 21. PLoS One. 2012. PMID: 22737239 Free PMC article. - Propagation of Parkinson's disease by extracellular vesicle production and secretion.
Shippey LE, Campbell SG, Hill AF, Smith DP. Shippey LE, et al. Biochem Soc Trans. 2022 Oct 31;50(5):1303-1314. doi: 10.1042/BST20220204. Biochem Soc Trans. 2022. PMID: 36111783 Free PMC article. Review. - Heat shock protein defenses in the neocortex and allocortex of the telencephalon.
Posimo JM, Weilnau JN, Gleixner AM, Broeren MT, Weiland NL, Brodsky JL, Wipf P, Leak RK. Posimo JM, et al. Neurobiol Aging. 2015 May;36(5):1924-37. doi: 10.1016/j.neurobiolaging.2015.02.011. Epub 2015 Feb 18. Neurobiol Aging. 2015. PMID: 25771395 Free PMC article.
References
- Dauer W., Przedborski S. (2003) Neuron 39, 889–909 - PubMed
- Cookson M. R. (2005) Annu. Rev. Biochem. 74, 29–52 - PubMed
- Braak H., Sastre M., Del Tredici K. (2007) Acta Neuropathol. 114, 231–241 - PubMed
- Terada S., Ishizu H., Yokota O., Tsuchiya K., Nakashima H., Ishihara T., Fujita D., Uéda K., Ikeda K., Kuroda S. (2003) Acta Neuropathol. 105, 163–169 - PubMed
Publication types
MeSH terms
Substances
Grants and funding
- P50 AG005131/AG/NIA NIH HHS/United States
- R01 AG018440/AG/NIA NIH HHS/United States
- R37 AG018440/AG/NIA NIH HHS/United States
- AG18440/AG/NIA NIH HHS/United States
- AG5131/AG/NIA NIH HHS/United States
LinkOut - more resources
Full Text Sources
Other Literature Sources
Molecular Biology Databases


