A statistical method for the detection of alternative splicing using RNA-seq - PubMed (original) (raw)
A statistical method for the detection of alternative splicing using RNA-seq
Liguo Wang et al. PLoS One. 2010.
Abstract
Deep sequencing of transcriptome (RNA-seq) provides unprecedented opportunity to interrogate plausible mRNA splicing patterns by mapping RNA-seq reads to exon junctions (thereafter junction reads). In most previous studies, exon junctions were detected by using the quantitative information of junction reads. The quantitative criterion (e.g. minimum of two junction reads), although is straightforward and widely used, usually results in high false positive and false negative rates, owning to the complexity of transcriptome. Here, we introduced a new metric, namely Minimal Match on Either Side of exon junction (MMES), to measure the quality of each junction read, and subsequently implemented an empirical statistical model to detect exon junctions. When applied to a large dataset (>200M reads) consisting of mouse brain, liver and muscle mRNA sequences, and using independent transcripts databases as positive control, our method was proved to be considerably more accurate than previous ones, especially for detecting junctions originated from low-abundance transcripts. Our results were also confirmed by real time RT-PCR assay. The MMES metric can be used either in this empirical statistical model or in other more sophisticated classifiers, such as logistic regression.
Conflict of interest statement
Competing Interests: The authors have declared that no competing interests exist.
Figures
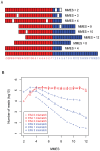
Figure 1. MMES metric and its skewed distribution over ESJ and ERJ.
(A) Calculation of Minimal Match on Either Side (MMES) of junction. Each square represents a nucleotide. The figure shows that eight 25-mer reads are aligned to a 42-mer exon junction (the bottom). The exon junction is composed of two equal parts: the left part (filled in red) is from the last 21bp of the upstream exon, and the right part (filled in blue) is from the first 21 bp of the downstream exon. Within aligned reads, the matched nucleotides are colored in either red (left) or blue (right), and the mismatch nucleotides are blank. MMES score is placed on the right side of each read. (B) MMES score (see main text) distribution on Exon Splicing Junction (ESJ, red lines) and Exon Random Junction (ERJ, blue lines). For both ESJ and ERJ, mapped reads are divided into 3 categories: 0 mismatch (circle), 1 mismatch (triangle) and 2 mismatches (cross).
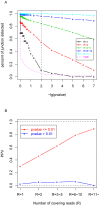
Figure 2. Performance of MMES based empirical method.
(A) Relationship between “percent of splicing junctions detected” and p-value cut-off threshold. Splicing junctions are grouped by the number of covering reads R, the pink line indicates the incurred FDR when the corresponding cutting-off p-value is selected, and the vertical dashed line indicates the p-value = 0.01 cutoff (with incurred FDR = 4.8%). (B) In case of p-value threshold = 0.01, all junctions are divided into two classes: those junctions with p-value≤0.01 are predicted to be real, while those junctions with p-value>0.01 are predicted to be false. Each class is further divided into 5 sub-classes according to number of covering reads. For each sub-class, percent of junctions verified (PPV) is calculated by cross validating predicted junctions with combined alternative splicing database.
Figure 3. Comparison of MMES based empirical approach with read-counting method and logistic regression model.
(A) All splicing junctions predicted by either method are divided into 3 non-overlapping categories: “P0.01_uniq” refers to those junctions with only 1 covering read but with p-value≤0.01 (green); “R2_uniq” refers to junctions with at least 2 covering reads but with p-value>0.01 (red). “Common” refers to those junctions with at least 2 covering reads and with p-value≤0.01 (blue). (B) Validation rate (PPV) for “P0.01_uniq”, “R2_uniq”, and “Common”, respectively. (C) “P0.01_uniq” refers to those junctions detected by MMES based empirical method only (green), “LR_uniq” refers to those junctions identified by logistic regression only (red), “BothSig” refers to junctions identified by both models (blue) and “BothUnsig” refers to junctions rejected by both method. (D) Validation rate (PPV) for “P0.01_uniq”, “LR_uniq”, and “Common”, respectively.
Similar articles
- PacBio full-length cDNA sequencing integrated with RNA-seq reads drastically improves the discovery of splicing transcripts in rice.
Zhang G, Sun M, Wang J, Lei M, Li C, Zhao D, Huang J, Li W, Li S, Li J, Yang J, Luo Y, Hu S, Zhang B. Zhang G, et al. Plant J. 2019 Jan;97(2):296-305. doi: 10.1111/tpj.14120. Epub 2018 Dec 3. Plant J. 2019. PMID: 30288819 - Differentially expressed alternatively spliced genes in malignant pleural mesothelioma identified using massively parallel transcriptome sequencing.
Dong L, Jensen RV, De Rienzo A, Gordon GJ, Xu Y, Sugarbaker DJ, Bueno R. Dong L, et al. BMC Med Genet. 2009 Dec 31;10:149. doi: 10.1186/1471-2350-10-149. BMC Med Genet. 2009. PMID: 20043850 Free PMC article. - Discerning novel splice junctions derived from RNA-seq alignment: a deep learning approach.
Zhang Y, Liu X, MacLeod J, Liu J. Zhang Y, et al. BMC Genomics. 2018 Dec 27;19(1):971. doi: 10.1186/s12864-018-5350-1. BMC Genomics. 2018. PMID: 30591034 Free PMC article. - Multiplexed primer extension sequencing: A targeted RNA-seq method that enables high-precision quantitation of mRNA splicing isoforms and rare pre-mRNA splicing intermediates.
Gildea MA, Dwyer ZW, Pleiss JA. Gildea MA, et al. Methods. 2020 Apr 1;176:34-45. doi: 10.1016/j.ymeth.2019.05.013. Epub 2019 May 21. Methods. 2020. PMID: 31121301 Free PMC article. Review. - Overview of available methods for diverse RNA-Seq data analyses.
Chen G, Wang C, Shi T. Chen G, et al. Sci China Life Sci. 2011 Dec;54(12):1121-8. doi: 10.1007/s11427-011-4255-x. Epub 2012 Jan 7. Sci China Life Sci. 2011. PMID: 22227904 Review.
Cited by
- VALERIE: Visual-based inspection of alternative splicing events at single-cell resolution.
Wen WX, Mead AJ, Thongjuea S. Wen WX, et al. PLoS Comput Biol. 2020 Sep 8;16(9):e1008195. doi: 10.1371/journal.pcbi.1008195. eCollection 2020 Sep. PLoS Comput Biol. 2020. PMID: 32898151 Free PMC article. - Design of RNA splicing analysis null models for post hoc filtering of Drosophila head RNA-Seq data with the splicing analysis kit (Spanki).
Sturgill D, Malone JH, Sun X, Smith HE, Rabinow L, Samson ML, Oliver B. Sturgill D, et al. BMC Bioinformatics. 2013 Nov 9;14:320. doi: 10.1186/1471-2105-14-320. BMC Bioinformatics. 2013. PMID: 24209455 Free PMC article. - ViralFusionSeq: accurately discover viral integration events and reconstruct fusion transcripts at single-base resolution.
Li JW, Wan R, Yu CS, Co NN, Wong N, Chan TF. Li JW, et al. Bioinformatics. 2013 Mar 1;29(5):649-51. doi: 10.1093/bioinformatics/btt011. Epub 2013 Jan 12. Bioinformatics. 2013. PMID: 23314323 Free PMC article. - Single-Cell RNA-Sequencing in Glioma.
Johnson E, Dickerson KL, Connolly ID, Hayden Gephart M. Johnson E, et al. Curr Oncol Rep. 2018 Apr 10;20(5):42. doi: 10.1007/s11912-018-0673-2. Curr Oncol Rep. 2018. PMID: 29637300 Free PMC article. Review. - Detection of splicing events and multiread locations from RNA-seq data based on a geometric-tail (GT) distribution of intron length.
Lou SK, Li JW, Qin H, Yim AK, Lo LY, Ni B, Leung KS, Tsui SK, Chan TF. Lou SK, et al. BMC Bioinformatics. 2011;12 Suppl 5(Suppl 5):S2. doi: 10.1186/1471-2105-12-S5-S2. Epub 2011 Jul 27. BMC Bioinformatics. 2011. PMID: 21988959 Free PMC article.
References
- Johnson JM, Castle J, Garrett-Engele P, Kan Z, Loerch PM, et al. Genome-wide survey of human alternative pre-mRNA splicing with exon junction microarrays. Science. 2003;302:2141–2144. - PubMed
- Pan Q, Shai O, Lee LJ, Frey BJ, Blencowe BJ. Deep surveying of alternative splicing complexity in the human transcriptome by high-throughput sequencing. Nat Genet. 2008;40:1413–1415. - PubMed
- Venables JP. Aberrant and alternative splicing in cancer. Cancer Res. 2004;64:7647–7654. - PubMed
- Grasso C, Modrek B, Xing Y, Lee C. Genome-wide detection of alternative splicing in expressed sequences using partial order multiple sequence alignment graphs. Pac Symp Biocomput. 2004:29–41. - PubMed
Publication types
MeSH terms
Substances
LinkOut - more resources
Full Text Sources


