B cell activation by outer membrane vesicles--a novel virulence mechanism - PubMed (original) (raw)
B cell activation by outer membrane vesicles--a novel virulence mechanism
Maria Laura A Perez Vidakovics et al. PLoS Pathog. 2010.
Abstract
Secretion of outer membrane vesicles (OMV) is an intriguing phenomenon of Gram-negative bacteria and has been suggested to play a role as virulence factors. The respiratory pathogens Moraxella catarrhalis reside in tonsils adjacent to B cells, and we have previously shown that M. catarrhalis induce a T cell independent B cell response by the immunoglobulin (Ig) D-binding superantigen MID. Here we demonstrate that Moraxella are endocytosed and killed by human tonsillar B cells, whereas OMV have the potential to interact and activate B cells leading to bacterial rescue. The B cell response induced by OMV begins with IgD B cell receptor (BCR) clustering and Ca(2+) mobilization followed by BCR internalization. In addition to IgD BCR, TLR9 and TLR2 were found to colocalize in lipid raft motifs after exposure to OMV. Two components of the OMV, i.e., MID and unmethylated CpG-DNA motifs, were found to be critical for B cell activation. OMV containing MID bound to and activated tonsillar CD19(+) IgD(+) lymphocytes resulting in IL-6 and IgM production in addition to increased surface marker density (HLA-DR, CD45, CD64, and CD86), whereas MID-deficient OMV failed to induce B cell activation. DNA associated with OMV induced full B cell activation by signaling through TLR9. Importantly, this concept was verified in vivo, as OMV equipped with MID and DNA were found in a 9-year old patient suffering from Moraxella sinusitis. In conclusion, Moraxella avoid direct interaction with host B cells by redirecting the adaptive humoral immune response using its superantigen-bearing OMV as decoys.
Conflict of interest statement
The authors have declared that no competing interests exist.
Figures
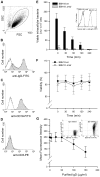
Figure 1. Internalized MID-expressing M. catarrhalis do not survive in tonsillar B cells.
(A) A representative dot plot displaying forward and side scatters of the purified tonsillar B cells used for live-cell gating. Each preparation of purified tonsillar B lymphocytes were analysed as routine control by flow cytometry for IgD (B), CD19 (C), and CD3 (D) expression. White profiles correspond to the isotype control Abs used as negative controls. Representative flow cytometry plots are shown. (E) M. catarrhalis wild type (BBH18 wt) or an isogenic MID-deficient mutant (BBH18 Δ_mid_) were incubated with purified tonsillar B lymphocytes for 1 h. Thereafter, B cells were washed and treated with gentamicin to kill extracellular bacteria followed by thorough washes. At the indicated times, infected cells were lysed mechanically and plated on agar plates. Colony forming units (cfu) were counted after incubation for 24 h at 37°C. The mean values of three separate experiments with different donors are demonstrated. Error bars indicate SEM. Insert shows IgD binding to M. catarrhalis BBH18 wt and the MID-deficient mutant BBH18 Δ_mid_. Bacteria were grown on solid medium overnight. After incubation with a human IgD standard serum followed by a FITC-conjugated anti-human IgD pAb and several washings, bacteria were analyzed by flow cytometry. (F) The viability of B cells infected with M. catarrhalis BBH18 wt and BBH18 Δ_mid_ was assessed at the indicated times by trypan blue exclusion staining. The mean values of three independent experiments are demonstrated. Error bars indicate SEM. (G) The capacity of purified human IgD to block M. catarrhalis binding to B cells was analyzed by flow cytometry. FITC-labelled M. catarrhalis wild type were treated with increased concentrations of purified human IgD, washed and incubated with human B cells for 30 min at 37°C. After several washes, bacterial binding to B cells were analyzed by flow cytometry. The mean values of three independent experiments are demonstrated. Error bars indicate SEM. Insert shows IgD-binding to FITC-labelled M. catarrhalis. Bacteria were incubated with a human IgG standard (50 µg/ml) (left panel) or purified IgD (50 µg/ml) (right panel). After several washes, Moraxella were incubated with an RPE-conjugated anti-human IgD mAb and analyzed by flow cytometry.
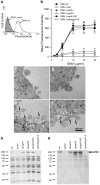
Figure 2. M. catarrhalis OMV bind to tonsillar lymphocytes through an interaction via MID and the IgD B cell receptor.
(A) A typical flow cytometry experiment with OMV and B cells. Control B lymphocytes (shaded) and cells incubated with FITC-labelled OMV wild type (OMV-wt) or MID-deficient OMV (OMV-Δ_mid_). OMV were used at 10 µg/ml and incubated with B cells for 1 h at 37°C. (B) Concentration-dependent binding of OMV to B cells. Increased concentrations of FITC-labeled OMV were incubated with B cells for 1 h followed by flow cytometry analyses. Data are presented as mean±SEM of 3 experiments. (C, D) B cells and OMV interactions analyzed in TEM showed binding of several OMV to the B cell surface. (E, F) IgD molecules were clustered upon OMV binding: gold-labelled antibodies demonstrated formation of a tight cluster of IgD (large granules; white arrows) and MID (small granules; black arrows). The bars represent 100 nm in length. The expression of MID in OMV isolated from different M. catarrhalis isogenic mutants was analyzed by SDS-PAGE (G) and Western blot (H) using MID specific rabbit pAbs. Molecular weight markers in kilodalton are indicated to the left.
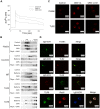
Figure 3. Ca2+ mobilization and B cell receptor clustering are induced by OMV.
(A) Mobilization of [Ca2+]i in human tonsillar B cells induced by Moraxella OMV. Purified Fura-2 loaded B cells were stimulated with wild-type OMV (10 µg/ml), MID-deficient OMV (10 µg/ml) or ionomycin (100 nM). Ca2+ mobilization was analyzed as described in Materials and Methods. Each experiment was repeated with at least three different donors with comparable results. (B) Aliquots of Triton-insoluble lysates of B cells obtained before (Control) and after stimulation with formaldehyde-fixed M. catarrhalis wild type (Bacteria), OMV or treated with filipin prior to stimulation with OMV (Filipin + OMV) were fractionated on discontinuous sucrose gradients and were immunoblotted with anti-flotillin, anti-caveolin, anti-TLR2, anti-IgD or anti-TLR9 mAbs. (C) Visualization of receptor clustering in lipid rafts. B cells unstimulated (Control), wild type OMV (OMV wt) or MID-deficient OMV (OMV Δ_mid_) stimulated for 30 min were fixed and stained with anti-flotillin (top) or anti-TLR2 (bottom). Alexa Fluor 594 goat anti-mouse IgG pAb were used as a secondary layer. (D) Colocalization of flotillin, TLR2, Rab5 and TLR9 with IgD (BCR) confirmed by confocal microscopy. Purified B cells were incubated with OMV for 30 min, fixed and stained with FITC-conjugated or RPE-conjugated mAbs against IgD (BCR) and FITC-conjugated anti-TLR9 mAb, anti-flotillin mAb or anti-TLR2 mAb using Alexa Fluor 594-conjugated secondary pAb. For the triple staining, stimulated B cells were incubated with rabbit anti-IgD pAb (BCR) and mouse anti-Rab5 mAb (Rab5). After several washes, B cells were incubated with Alexa Fluor 633 goat anti-mouse IgG and Alexa Fluor 546 goat anti-rabbit IgG secondary mAb followed by incubation with FITC-conjugated anti-TLR9 mAb (TLR9). The lymphocytes shown are representatives of more than 90% of the cells imaged in 3 separate experiments with different donors.
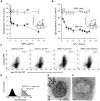
Figure 4. OMV induce a down-regulation of surface expressed IgD in a dose dependent manner and are internalised by tonsilar B cells.
Changes in surface expression of IgD and IgM after OMV binding to B cells were analyzed by flow cytometry. (A) Purified tonsil B cells were incubated with different concentrations of OMV ranging from 150 ng/ml to 10 µg/ml and monitored for IgD and IgM expression after 24 h at 37°C. Insert shows a representative flow cytometry profile of IgD-labelled B cells that were left unstimulated (shaded) or stimulated with OMV (white). (B) The kinetics of IgD internalization was examined after incubation with 10 µg of either OMV wild type (OMV-wt) or MID-deficient OMV (OMV-Δ_mid_). Data are shown as arbitrary units comparing Ig densities at different time-points with expression at time 0 h set to 100%. Error bars indicate SEM from four and three different donors in panels A and B, respectively. Insert shows a representative flow cytometry profile of IgD-labelled B cells that were unstimulated (shaded) or stimulated with OMV wt (white). (C) The IgD internalization after OMV stimulation was examined by flow cytometry. Unstimulated (control) B cells or B cells stimulated with 10 µg/ml of OMV wild type (OMV wt) or MID-deficient OMV (OMV Δ_mid_) were fixed and incubated with FITC-conjugated anti-CD19 mAb and rabbit anti-IgD pAb to block the surface expressed BCR. After several washes, B cells were permeabilized and incubated with RPE-conjugated anti-IgD mAb and analyzed by flow cytometry. The data shown are representative of those from three independent experiments. (D) Representative flow cytometry experiment of OMV entry into B cells. Control B cells (shaded) and cells incubated with FITC–labeled OMV before (OMV-FITC) and after quenching with trypan blue (OMV-FITC + trypan blue). (E, F) B cells and OMV interactions analyzed in TEM showed internalisation of MID containing OMV. The endosome with two OMV is magnified in (F) and gold-labelled antibodies against IgD (large granules; white arrows) and MID (small granules; black arrows) are indicated. The scale in (E) and (F) represents 1 µm and 100 nm in length, respectively.
Figure 5. OMV containing MID activate tonsillar B cells.
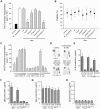
(A) The mitogenic effect of M. catarrhalis OMV isolated from different strains on B cells was analyzed by measuring thymidine uptake at 96 h. Error bars indicating SEM from 6 different donors, * p≤0.05, OMV versus control. (B) The viability of B lymphocytes after OMV stimulation was assessed by trypan blue exclusion staining. (C) Purified B cells were stimulated with different concentrations of OMV with or without MID (OMV Δ_mid_), whole M. catarrhalis wild type or its isogenic mutant or recombinant MID962-1200 as indicated. The OMV concentrations used were in the range of 0.1–25 µg/ml. Error bars indicate SEM from 5 different donors. (D) OMV activated B cells mainly produce IL-6. Purified B cells were incubated with 10 µg/ml OMV wild type (OMV wt) or MID-deficient OMV (OMV Δ_mid_) for 96 h. Thereafter, the cytokine contents in the B cell culture supernatants were determined using a human cytokine protein array. The protein microarray cut-off controls are indicated as positive controls. Complete medium and a culture supernatant from unstimulated B cells were included as a negative control. A minor up-regulation of IL-10 and GRO was also detected. (E–H) OMV binding to B cells induces IL-6 and IgM secretion. The stimulatory effect of M. catarrhalis OMV on B cells was analyzed by measuring IL-6 secretion at 48 h (E) and IgM (F), IgG (G) or IgA (H) production at 96 h. B cells were activated with 10 µg/ml OMV isolated from MID-expressing bacteria (wt) or a MID-deficient mutant (Δmid). In addition, whole M. catarrhalis wild type (wt), its isogenic mutant (Δmid), or recombinant MID962-1200 were included in the analysis. Error bars indicate SEM from 5 (E) and 3 (F–H) different donors.
Figure 6. OMV cause up-regulation of B cell surface markers.
OMV induced changes in expression of HLA-DR (A), CD86 (B), CD69 (C) and CD45 (D). Surface expression of B cell activation markers after OMV stimulation was analyzed by flow cytometry. Unstimulated B cells are shown as filled profiles (gray) and B cells incubated with OMV wt (left panels) or MID-deficient OMV (OMV Δ_mid_, right panels) are indicated as white profiles. Representative results from one out of three donors are shown. (E–G) Flow cytometry analysis of TLR9 expression in B cells stimulated with OMV. Purified B cells were either unstimulated (E) or incubated with 10 µg/ml of OMV-wt (F) or OMV-Δ_mid_ (G) for 30 min. Thereafter, B cells were double stained with RPE-conjugated anti-CD19 and FITC-conjugated anti-TLR9 mAbs followed by flow cytometry analysis. In panels (E) to (G), the TLR9-negative CD19+ B cell population is encircled to illustrate the CD19+TLR9− population that decreased after stimulation. Data are representative for 3 similar profiles obtained from separate donors. (H) Flow cytometry analysis of surface TLR9 expression in OMV-stimulated B cells. Unstimulated B cells are shown as a grey profile. B cells stimulated with OMV wt or MID-deficient OMV for 30 min are shown as dark black and blue line profile, respectively. Isotype control Ab-labelled B cells are shown as a red line profile. One representative histogram is shown out of three independent experiments. (I) Relative levels of TLR9 transcripts in OMV-stimulated human tonsillar B cells. Purified B cells were either unstimulated (control) or incubated with 10 µg/ml OMV wild type (OMV wt) or MID-deficient OMV (OMV Δ_mid_) for 30 min. Expression levels were determined using quantitative real-time reverse transcription-polymerase chain reaction (RT-PCR) and are depicted in relation to the internal control gene, β-actin, as 2ΔCt×105. Data from experiments with cells from 3 different donors are summarized and presented as mean±SEM.
Figure 7. TLR9 participates in OMV-dependent B cell activation.
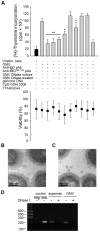
(A) B cell proliferation was measured by means of [methyl-3H]-thymidine incorporation after 96 h. OMV from the MID-expressing M. catarrhalis wild type (OMV) were combined with different additives as indicated in the figure. OMV isolated from M. catarrhalis growing in presence of DNase (OMV DNase culture) and OMV treated with DNase after isolation (OMV DNase-treated) were also included. The viability of B lymphocytes after each treatment was measured by trypan blue exclusion staining. Error bars indicate SEM from 5 different donors. The presence of DNA associated with OMV from DNase treated bacterial culture (B) or untreated culture (C) were analyzed by TEM using gold labelling anti-DNA pAb. (D) The presence of DNA associated with OMV was confirmed by PCR. DNA extractions from OMV DNase-treated or untreated samples were used as template for amplification of the genomic 16S rRNA gene. M. catarrhalis genomic DNA was used as a positive control and an ultracentrifuge supernatant (free of bacteria and OMV) from DNase treated and untreated cultures were also analyzed to check the presence of extracellular DNA. Representative images from three independent experiments are shown. * p≤0.05, OMV DNase-treated versus OMV and OMV DNase-treated + genomic DNA versus OMV DNase-treated; ** p≤0.01, OMV versus unstimulated cells.
Figure 8. M. catarrhalis OMV secreted in vivo contain MID and DNA.
A clinical sample from a 9-year old patient was analysed and TEM showed the presence of MID (A) and DNA (B) on OMV. In (C) MID and DNA associated with OMV is marked with gold-labelled antibodies against MID (large granules, black arrows) and DNA (small granules, white arrows). The scale bar in (A–C) represents 100 nm in length. (D) Representative flow cytometry profiles of FITC-labelled OMV isolated from the clinical isolate M. catarrhalis KR971 (white) as compared to OMV from the MID-deficient M. catarrhalis BBH18 Δ_mid_ (shaded) when bound to purified tonsilar B lymphocytes. OMV were used at 10 µg/ml and incubated with B cells for 1 h at 37°C. (E) MID expression in OMV isolated from the clinical isolate of M. catarrhalis was analyzed by SDS-PAGE (Ag-stain) and Western blot (WB) using MID specific rabbit pAbs. Molecular weight markers in kilodalton are indicated to the left.
Figure 9. Cartoon schematically showing M. catarrhalis OMV-dependent B cell activation.
OMV discharged from Moraxella are taken up by B cells via an IgD-mediated cross-linking and endocytosis. A signal is induced via the MID-mediated contact with the IgD B cell receptor followed by formation of lipid rafts. In addition, TLR2 colocalize in lipid raft motifs and participate in the signaling induced by OMV. In the endosome, DNA-containing OMV are activating TLR9. The IgD BCR and TLR2/9 mediated signaling results in IL-6 production and eventually IgM secretion.
Similar articles
- Superantigen- and TLR-dependent activation of tonsillar B cells after receptor-mediated endocytosis.
Jendholm J, Mörgelin M, Perez Vidakovics ML, Carlsson M, Leffler H, Cardell LO, Riesbeck K. Jendholm J, et al. J Immunol. 2009 Apr 15;182(8):4713-20. doi: 10.4049/jimmunol.0803032. J Immunol. 2009. PMID: 19342647 - Diversion of the host humoral response: a novel virulence mechanism of Haemophilus influenzae mediated via outer membrane vesicles.
Deknuydt F, Nordström T, Riesbeck K. Deknuydt F, et al. J Leukoc Biol. 2014 Jun;95(6):983-91. doi: 10.1189/jlb.1013527. Epub 2014 Feb 18. J Leukoc Biol. 2014. PMID: 24550522 - Multicomponent Moraxella catarrhalis outer membrane vesicles induce an inflammatory response and are internalized by human epithelial cells.
Schaar V, de Vries SP, Perez Vidakovics ML, Bootsma HJ, Larsson L, Hermans PW, Bjartell A, Mörgelin M, Riesbeck K. Schaar V, et al. Cell Microbiol. 2011 Mar;13(3):432-49. doi: 10.1111/j.1462-5822.2010.01546.x. Epub 2010 Nov 24. Cell Microbiol. 2011. PMID: 21044239 - A role for TLRs in Moraxella-superantigen induced polyclonal B cell activation.
Singh K, Bayrak B, Riesbeck K. Singh K, et al. Front Biosci (Schol Ed). 2012 Jan 1;4(3):1031-43. doi: 10.2741/s316. Front Biosci (Schol Ed). 2012. PMID: 22202107 Review. - Structure and immunological action of the human pathogen Moraxella catarrhalis IgD-binding protein.
Riesbeck K, Nordstrom T. Riesbeck K, et al. Crit Rev Immunol. 2006;26(4):353-76. doi: 10.1615/critrevimmunol.v26.i4.40. Crit Rev Immunol. 2006. PMID: 17073558 Review.
Cited by
- Pathogenesis Mediated by Bacterial Membrane Vesicles.
Gilmore WJ, Bitto NJ, Kaparakis-Liaskos M. Gilmore WJ, et al. Subcell Biochem. 2021;97:101-150. doi: 10.1007/978-3-030-67171-6_6. Subcell Biochem. 2021. PMID: 33779916 - Microbial Extracellular Vesicles in Host-Microbiota Interactions.
Abubaker S, Miri S, Mottawea W, Hammami R. Abubaker S, et al. Results Probl Cell Differ. 2024;73:475-520. doi: 10.1007/978-3-031-62036-2_19. Results Probl Cell Differ. 2024. PMID: 39242390 Review. - Comparative Analysis of Membrane Vesicles from Three Piscirickettsia salmonis Isolates Reveals Differences in Vesicle Characteristics.
Tandberg JI, Lagos LX, Langlete P, Berger E, Rishovd AL, Roos N, Varkey D, Paulsen IT, Winther-Larsen HC. Tandberg JI, et al. PLoS One. 2016 Oct 20;11(10):e0165099. doi: 10.1371/journal.pone.0165099. eCollection 2016. PLoS One. 2016. PMID: 27764198 Free PMC article. - Inhibitors of Bacterial Extracellular Vesicles.
Chen J, Zhang H, Wang S, Du Y, Wei B, Wu Q, Wang H. Chen J, et al. Front Microbiol. 2022 Feb 23;13:835058. doi: 10.3389/fmicb.2022.835058. eCollection 2022. Front Microbiol. 2022. PMID: 35283837 Free PMC article. Review. - The enigmatic function of IgD: some answers at last.
Gutzeit C, Chen K, Cerutti A. Gutzeit C, et al. Eur J Immunol. 2018 Jul;48(7):1101-1113. doi: 10.1002/eji.201646547. Epub 2018 Jun 12. Eur J Immunol. 2018. PMID: 29733429 Free PMC article. Review.
References
- Karalus R, Campagnari A. Moraxella catarrhalis: a review of an important human mucosal pathogen. Microbes Infect. 2000;2:547–559. - PubMed
- Slevogt H, Seybold J, Tiwari KN, Hocke AC, Jonatat C, et al. Moraxella catarrhalis is internalized in respiratory epithelial cells by a trigger-like mechanism and initiates a TLR2- and partly NOD1-dependent inflammatory immune response. Cell Microbiol 2006 - PubMed
Publication types
MeSH terms
Substances
LinkOut - more resources
Full Text Sources
Other Literature Sources
Research Materials
Miscellaneous
