S100a9 knockdown decreases the memory impairment and the neuropathology in Tg2576 mice, AD animal model - PubMed (original) (raw)
S100a9 knockdown decreases the memory impairment and the neuropathology in Tg2576 mice, AD animal model
Tae-Young Ha et al. PLoS One. 2010.
Abstract
Inflammation, insoluble protein deposition and neuronal cell loss are important features in the Alzheimer's disease (AD) brain. To investigate the regulatory genes responsible for the neuropathology in AD, we performed microarray analysis with APP(V717I)-CT100 transgenic mice, an animal model of AD, and isolated the S100a9 gene, which encodes an inflammation-associated calcium binding protein. In another AD animal model, Tg2576 mouse brain, and in human AD brain, induction of S100a9 was confirmed. The endogenous expression of S100a9 was induced by treatment with Abeta or CT peptides in a microglia cell line, BV2 cells. In these cells, silencing study of S100a9 showed that the induction of S100a9 increased the intracellular calcium level and up-regulated the inflammatory cytokines (IL-1beta and TNFalpha) and iNOS. S100a9 lentiviral short hairpin RNA (sh-S100a9) was injected into the hippocampus region of the brains of 13-month-old Tg2576 mice. At two months after injection, we found that knockdown of S100a9 expression had improved the cognition decline of Tg2576 mice in the water maze task, and had reduced amyloid plaque burden. These results suggest that S100a9 induced by Abeta or CT contributes to cause inflammation, which then affects the neuropathology including amyloid plaques burden and impairs cognitive function. Thus, the inhibition of S100a9 is a possible target for AD therapy.
Conflict of interest statement
Competing Interests: The authors have declared that no competing interests exist.
Figures
Figure 1. S100a9 was induced in the brains of CT-Tg, Tg2576 mice and Human AD patients.
(A) mRNA levels of S100a9 were measured in the cortex and hippocampus of CT-Tg and age-matched WT mice brains by RT-PCR. Actin was used as a loading control. The protein level of S100a9 was checked by western blotting. Tubulin was used as a loading control. (B) S100a9 expression was normalized with that of tubulin for quantification (n = 5). Results are presented as the means ± SEM. *P <0.05, **P<0.01 by Student's _t-_test. (C) Immunoreactivities of S100a9 were examined in the cortex, hippocampus [CA3, dentate gyrus (DG)] of 11-month-old CT-Tg, of 11-month-old Tg2576 and of human AD brains compared with normal age-matched brains. Scale bar represents 100 µm.
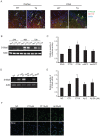
Figure 2. Aβ and CT induced S100a9 expression in BV2 cells.
(A) Immunostaining for S100a9 (green) and CD11b (red) was performed in the cortex and CA3 of Tg and wild-type mouse brains. DAPI (blue) staining indicates the nuclei. Scale bars represent 20 µm. WT and Tg represent wild-type control and transgenic animals, respectively. (B) The mRNA levels of S100a9 were checked at 24 h, 48 h, and 72 h post-transfection with CT50 or CT99 by RT-PCR. (C) Human S100a9 promoter in pGL3 vector was cotransfected with CT, wtAPP or sweAPP in pcDNA vector and fe65 into SHSY5Y cells. 48 h after transfection, luciferase reporter assays were performed for CT50, CT99, wtAPP and sweAPP, the four S100a9 targets. Luciferase activities were normalized versus the obtained protein concentrations. The histogram shows the ratio of luciferase activity in transfected cells to empty vector-transfected cells (n = 5). (D) RT-PCR of S100a9 induced at 48 h post-treatment with 1 µM and 10 µM CT or 2 µM and 20 µM Aβ. (E) The quantification of RT-PCR normalized to actin (n = 8). (F) Immunocytochemistry; BV2 cells grown on a glass coverslip were treated with CT (5 µM and 10 µM) and Aβ (20 µM) for 48 h. S100a9-positive cells were visualized with FITC (green)-conjugated secondary antibodies. Nuclei were counter-stained with DAPI (blue). Scale bars represent 20 µm. All data are presented as the means±SEM. *P<0.05, **P<0.01 by Student's t –test.
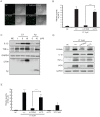
Figure 3. S100a9 induced by Aβ or CT increased [Ca2+]i level and proinflammatory cytokines in BV2 cells.
(A) [Ca2+]i images obtained by Fluo3 AM at 48 h after treatment with 10
µM CT and 20 nM si-S100a9 in BV2 cells. Scale bars represent 50 µm. si-CTL is a control containing the scrambled sequence of S100a9 (B) The histogram shows the ratio of [Ca2+]i levels to NC group. [Ca2+]i levels in BV2 cells treated with CT and si-S100a9 was compared to that in BV2 cells with CT and si-CTL (control) (n = 5). (C) After treatment with 1, 5, or 10µM CT and 5 or 10 µM Aβ to BV2 cells, the levels of the pro-inflammatory cytokines, IL-1β and TNF-α, were measured by western blotting. The membrane was stripped and reprobed with GAPDH to confirm equal loading and with 6E10 antibody to confirm intracellular CT and Aβ. (D) At 48 h post-treatment with si-S100a9, expressions of S100a9, IL-1β, TNF-α and iNOS were attenuated. The membrane was stripped and reprobed with GAPDH to confirm equal loading. (E) At 48 h post-treatment with 10µM CT and si-S100a9, NO release (µM) was measured by Griess reagent. LPS (1 µg/ml) was used as a positive control. All data are presented as the means ± SEM (n = 10). NC: negative control (non-treated cell) **P<0.01, ***P <0.001 by Student's t -test and one-way ANOVA.
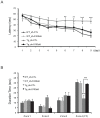
Figure 4. Treatment with shRNA-S100a9 attenuated learning and memory impairment in Tg2576 mice.
(A) Morris water maze task was performed 2 months after lentiviral infection. The task was conducted for 9 consecutive days. A significant difference was observed between the Tg_sh-S100a9 group and the Tg_sh-CTL group from the 6th day of the Morris water maze task. (B) The probe test was carried out 48 h after the final trial. Tg_sh-S100a9 group showed memory improvement compared to Tg_sh-CTL in zone 4 where the platform had been hidden (n = 8 per group). **P<0.01, ***P<0.001 by one-way ANOVA.
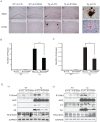
Figure 5. S100a9 knockdown reduced the number of amyloid plaques in Tg2576 mouse brains.
At 2 months after lentiviral infection, immunostaining and western blot analyses were performed. (A) Immunostaining with 6E10 antibody for the detection of amyloid plaque in the mouse brain of Hippocampus (Hippo) and Cortex. Higher-magnification view of box in (g) is shown in (i). (j) is Congo red stained image of (i). Scale bars represent 200 µm in (d&h) and 50 µm in (i&j). (B) The number of plaques was counted in whole brain of each group (n = 10). ***P <0.001 by Student's t- test (C) Size and density of plaques was measured by Multi-Gauge program (version 3.0) in whole brain of each group (n = 10). Results are presented as the means of (QL-BG) ± SEM. **P<0.01 by Student's t- test. (D) Western blot analysis was performed with total lysates from the cortical region (a) or hippocampus region (b) of the brains in each group using C9 for APP and CT, 6E10 for Aβ, anti-Neprilysin or anti-GAPDH antibody. All data represent the means ± SEM from at least five independent experiments.
Similar articles
- S100A9 knockout decreases the memory impairment and neuropathology in crossbreed mice of Tg2576 and S100A9 knockout mice model.
Kim HJ, Chang KA, Ha TY, Kim J, Ha S, Shin KY, Moon C, Nacken W, Kim HS, Suh YH. Kim HJ, et al. PLoS One. 2014 Feb 25;9(2):e88924. doi: 10.1371/journal.pone.0088924. eCollection 2014. PLoS One. 2014. PMID: 24586443 Free PMC article. - The role of S100a9 in the pathogenesis of Alzheimer's disease: the therapeutic effects of S100a9 knockdown or knockout.
Chang KA, Kim HJ, Suh YH. Chang KA, et al. Neurodegener Dis. 2012;10(1-4):27-9. doi: 10.1159/000333781. Epub 2012 Feb 1. Neurodegener Dis. 2012. PMID: 22301734 Review. - Human Alzheimer's disease gene expression signatures and immune profile in APP mouse models: a discrete transcriptomic view of Aβ plaque pathology.
Rothman SM, Tanis KQ, Gandhi P, Malkov V, Marcus J, Pearson M, Stevens R, Gilliland J, Ware C, Mahadomrongkul V, O'Loughlin E, Zeballos G, Smith R, Howell BJ, Klappenbach J, Kennedy M, Mirescu C. Rothman SM, et al. J Neuroinflammation. 2018 Sep 6;15(1):256. doi: 10.1186/s12974-018-1265-7. J Neuroinflammation. 2018. PMID: 30189875 Free PMC article. - CHF5074 (CSP-1103) induces microglia alternative activation in plaque-free Tg2576 mice and primary glial cultures exposed to beta-amyloid.
Porrini V, Lanzillotta A, Branca C, Benarese M, Parrella E, Lorenzini L, Calzà L, Flaibani R, Spano PF, Imbimbo BP, Pizzi M. Porrini V, et al. Neuroscience. 2015 Aug 27;302:112-20. doi: 10.1016/j.neuroscience.2014.10.029. Epub 2014 Oct 22. Neuroscience. 2015. PMID: 25450955 - S100A9-Driven Amyloid-Neuroinflammatory Cascade in Traumatic Brain Injury as a Precursor State for Alzheimer's Disease.
Wang C, Iashchishyn IA, Pansieri J, Nyström S, Klementieva O, Kara J, Horvath I, Moskalenko R, Rofougaran R, Gouras G, Kovacs GG, Shankar SK, Morozova-Roche LA. Wang C, et al. Sci Rep. 2018 Aug 27;8(1):12836. doi: 10.1038/s41598-018-31141-x. Sci Rep. 2018. PMID: 30150640 Free PMC article.
Cited by
- Mrp14 deficiency ameliorates amyloid β burden by increasing microglial phagocytosis and modulation of amyloid precursor protein processing.
Kummer MP, Vogl T, Axt D, Griep A, Vieira-Saecker A, Jessen F, Gelpi E, Roth J, Heneka MT. Kummer MP, et al. J Neurosci. 2012 Dec 5;32(49):17824-9. doi: 10.1523/JNEUROSCI.1504-12.2012. J Neurosci. 2012. PMID: 23223301 Free PMC article. - Pathophysiological features in the brains of female Spontaneously Diabetic Torii (SDT) fatty rats.
Maekawa T, Sugimoto M, Kume S, Ohta T. Maekawa T, et al. J Vet Med Sci. 2022 Mar 3;84(3):330-337. doi: 10.1292/jvms.21-0654. Epub 2022 Jan 27. J Vet Med Sci. 2022. PMID: 35082197 Free PMC article. - Microglia Transcriptome Changes in a Model of Depressive Behavior after Immune Challenge.
Gonzalez-Pena D, Nixon SE, O'Connor JC, Southey BR, Lawson MA, McCusker RH, Borras T, Machuca D, Hernandez AG, Dantzer R, Kelley KW, Rodriguez-Zas SL. Gonzalez-Pena D, et al. PLoS One. 2016 Mar 9;11(3):e0150858. doi: 10.1371/journal.pone.0150858. eCollection 2016. PLoS One. 2016. PMID: 26959683 Free PMC article. - Epigenetic scores of blood-based proteins as biomarkers of general cognitive function and brain health.
Smith HM, Moodie JE, Monterrubio-Gómez K, Gadd DA, Hillary RF, Chybowska AD, McCartney DL, Campbell A, Redmond P, Page D, Taylor A, Corley J, Harris SE, Valdés Hernández M, Muñoz Maniega S, Bastin ME, Wardlaw JM, Deary IJ, Boardman JP, Mullin DS, Russ TC, Cox SR, Marioni RE. Smith HM, et al. Clin Epigenetics. 2024 Mar 25;16(1):46. doi: 10.1186/s13148-024-01661-7. Clin Epigenetics. 2024. PMID: 38528588 Free PMC article. - Bridging the Gap Between Fluid Biomarkers for Alzheimer's Disease, Model Systems, and Patients.
Bjorkli C, Sandvig A, Sandvig I. Bjorkli C, et al. Front Aging Neurosci. 2020 Sep 2;12:272. doi: 10.3389/fnagi.2020.00272. eCollection 2020. Front Aging Neurosci. 2020. PMID: 32982716 Free PMC article. Review.
References
- Selkoe DJ. Alzheimer's disease: Genes, proteins, and therapy. Physiological Reviews. 2001;81:741–766. - PubMed
- Selkoe DJ. Alzheimer's disease is a synaptic failure. Science. 2002;298:789–791. - PubMed
- Lue LF, Brachova L, Civin WH, Rogers J. Inflammation, A beta deposition, and neurofibrillary tangle formation as correlates of Alzheimer's disease neurodegeneration. J Neuropathol Exp Neurol. 1996;55:1083–1088. - PubMed
- Hoozemans JJ, Veerhuis R, Rozemuller JM, Eikelenboom P. Neuroinflammation and regeneration in the early stages of Alzheimer's disease pathology. Int J Dev Neurosci. 2006;24:157–165. - PubMed
Publication types
MeSH terms
Substances
LinkOut - more resources
Full Text Sources
Other Literature Sources
Medical
Molecular Biology Databases
Miscellaneous


