Apical constriction and invagination downstream of the canonical Wnt signaling pathway require Rho1 and Myosin II - PubMed (original) (raw)
Apical constriction and invagination downstream of the canonical Wnt signaling pathway require Rho1 and Myosin II
Sandra G Zimmerman et al. Dev Biol. 2010.
Abstract
The tumor suppressor Adenomatous polyposis coli (APC) is a negative regulator of Wnt signaling and functions in cytoskeletal organization. Disruption of human APC in colonic epithelia initiates benign polyps that progress to carcinoma following additional mutations. The early events of polyposis are poorly understood, as is the role of canonical Wnt signaling in normal epithelial architecture and morphogenesis. To determine the consequences of complete loss of APC in a model epithelium, we generated APC2 APC1 double null clones in the Drosophila wing imaginal disc. APC loss leads to segregation, apical constriction, and invagination that result from transcriptional activation of canonical Wnt signaling. Further, we show that Wnt-dependent changes in cell fate can be decoupled from Wnt-dependent changes in cell shape. Wnt activation is reported to upregulate DE-cadherin in wing discs, and elevated DE-cadherin is thought to promote apical constriction. We find that apical constriction and invagination of APC null tissue are independent of DE-cadherin elevation, but are dependent on Myosin II activity. Further, we show that disruption of Rho1 suppresses apical constriction and invagination in APC null cells. Our data suggest a novel link between canonical Wnt signaling and epithelial structure that requires activation of the Rho1 pathway and Myosin II.
Copyright 2010 Elsevier Inc. All rights reserved.
Figures
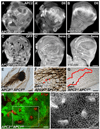
Fig. 1
APC null clones have smooth borders, apically constrict, invaginate and display elevated DE-cad. No GFP (green) = APC null clones. DE-cad (red or grey). Dotted lines indicate clone boundaries (B inset, E, G) or the edge of the disc (D). Larvae were maintained at 21–23°C. (A, A’) APC null clones 30 hours after clone induction have irregular borders. (B) By 40–42 hours after clone induction, 4% of APC null clones have smooth borders (arrows; n = 304 clones, 15 discs). Inset: rectangle in (B). A few mutant cells are apically constricted (arrow) and DE-cad appears increased at multicellular junctions (arrowhead). (C) Cross-section of clone in B showing slight invagination (arrow). (D) APC null clones 72 hours after clone induction exhibit smooth borders, apical constriction (arrow indicates adherens junctions [AJs]), and invagination (basal protrusion, arrowhead). (E) Projection of AJs in the pouch with elevated DE-cad in apically constricted cells. (F, F’) Cross-section of invaginated clone in E. Projection (G) and cross-section (H, H’) of AJs in apically constricted APC null cells in the notum without apparent elevated DE-cad. GFP expressing cells above AJs in (F, H) are peripodial cells. Scale bars: 10 µm in A, B, D–H; 5 µm in B (inset), C.
Fig. 2
APC null clones exhibit position dependent protrusion. Late 3rd larval instar wing discs (A–D”; 96–120 hours after clone induction) and pupal wings (E–H; 6 hours after puparium formation) labeled for GFP (green), phosphotyrosine (red, AJ marker), and propidium iodide (blue, nuclei) as indicated. Absence of GFP = clone. (A–A”) Wild type clones have uneven borders and are continuous with the surrounding epithelium. (B–C”) The position of AJs (arrowheads) indicates evaginating, apically protruding clones (single asterisks), and invaginating, basally protruding clones (double asterisks) in the dorsal hinge and ventral pleura. Clones in the pouch (D–D”) do not significantly invaginate and protrude at this time. (E–H) Pupal wings with wild-type (E, F, arrow) or APC null clones (G, H, arrow). Some clones in the blade have invaginated and protrude basally between the developing blades (H, arrow). Scale bars: 10 µm in A–D, F, H; 50 µm in E, G.
Fig. 3
Canonical Wnt pathway activation triggers morphological changes in APC null clones. Late 3rd larval instar wing discs. Clones expressing stabilized Arm (UAS-ArmS10-Myc; A–C’), and axin null clones (D, D’) closely resemble APC null clones by exhibiting apical constriction (A, A’) invagination/evagination (B, arrows indicate apical surface of invaginated clones; C–D’), and smooth borders (A–D’). Dotted lines indicate clone borders (based on Myc expression). (A’) Close-up of the area in the rectangle in A. (E–E2) The APC null phenotype is suppressed in APC null clones in the posterior compartment expressing TCFΔN and GFP driven by engrailed-GAL4 using mosaic analysis with a repressible cell marker (MARCM). While APC null clones in the posterior compartment express both GFP and TCFΔN, APC null clones in the anterior compartment do not express either GFP or TCFΔN (E, arrows). In the anterior compartment, clone boundaries were determined by loss of APC2 (not shown). (E1, E2) Close-ups of areas in rectangles in E’. (F) Quantification of average apical cell surface area ratios of indicated genotypes (ratio = average area per cell in clone cells/average area per cell in neighboring cells). Scale bars: 10 µm.
Fig. 4
Canonical Wnt-dependent cell shape changes can be decoupled from canonical Wnt-dependent cell fate transformation. (A–D) Late 3rd larval instar wing discs. (A, A’) Ectopic Dll expression in APC null clones, marked by the absence of APC2. (B) Wild type expression of Dll. (C, C’) Hypomorphic APC2ΔS APC1Q8 clones occasionally activate Sens (arrow). (D) Wild-type expression of Sens. (E–G) Adult wings with pawn (pwn) marked APC mutant clones. (E) pwn; APC2g10 APC1Q8 clones develop ectopic margin bristles in the blade. (F) pwn marked wing hairs in a pwn; APC2g10 APC1Q8 clone indicate a few cells that did not undergo the cell fate transformation (arrowheads). (G) pwn; APC2ΔS APC1Q8 clones in the blade (arrow) do not develop margin bristles. Line = clone border. (H) Late 3rd instar wing disc with APC2ΔS APC1Q8 clones in pouch, marked by absence of GFP. (H’) Optical projection of the area in rectangle (H) showing smooth borders and apical constriction in APC2ΔS APC1Q8 clones occur in the absence of change from blade to margin fate. Scale bars: 50 µm in A–G; 10 µm in H, H’.
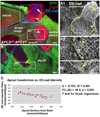
Fig. 5
DE-cad transcriptional upregulation does not positively correlate with apical constriction in APC null cells. Late 3rd larval instar wing discs. Antigens as indicated. APC null clones are indicated by the lack of GFP (green). DE-cad-lacZ transcriptional reporter activity is detected by immunolocalization of β-galactosidase (red). A1-B1 are projections of DE-cad immunolocalization of areas in rectangles in A, B. Apically constricted cells that lack DE-cad-lacZ activity (A, A1, B, B1, arrows). Some APC null cells that are not apically constricted activate the DE-cad-lacZ reporter (A, A1, A2, arrowheads; n=25 clones). In some regions of the disc cells appear to apically expand and apically extrude (A, A2, arrowheads). These apically expanded cells robustly activate the DE-cad-lacZ reporter. Dotted lines in A1, A2, B1 indicate clone boundaries. (C) Plot of statistically significant correlation between apical constriction and DE-cad pixel intensity. More apical constriction (smaller cell surface area ratio) correlates with higher DE-cad pixel intensity. Scale bars: 10 µm.
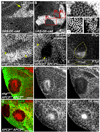
Fig. 6
Elevated DE-cad is neither necessary nor sufficient for the APC null phenotype. Late 3rd larval instar wing discs. (A–B) UAS-DE-cad overexpression using act>CD2>GAL4 FLP-out, marked by elevated DE-cad. UAS-DE-cad clones in notum with no apical constriction and exhibiting uneven (A) or smooth (B,B1) borders (arrow). (B2, B3) Close-ups of areas in rectangles B2 and B3 in (B) reveal no difference in apical surface area between cells expressing wild-type levels of DE-cad (B2) and cells expressing elevated DE-cad (B3). Contrast was adjusted in B2 and B3 for comparison. (C) Hypomorphic shgp34-1 clones (arrows) have largely normal morphology with reduced levels of DE-cad. (D–E) Apically constricted shgp34-1; APC2g10 APC1Q8 clone in the wing pouch (arrow). Constricted cells next to the clone (indicated with yellow arrowhead) belong to a neighboring +/shgp34-1; APC2g10 APC1Q8 clone. (D’) Phosphotyrosine staining reveals constricted cells that are invaginating (E, cross-section of clone in D’). Plane in D’ is at the level of the AJs of the invaginated cells. Clone outline (yellow line) is based on absence of β-galactosidase (not shown) and DE-cad reduction. (F-F”) shgp34-1; APC2g10 APC1Q8 clones basally protrude like APC2g10_APC1Q8_ clones (G–G”). Scale bars: 10 µm in A, B, C–D’, F, G; 5 µm in B1-B3, E.
Fig. 7
Apical constriction of APC null clones requires activated Myosin. Late 3rd larval instar wing discs. Yellow lines indicate clone borders. All clones are in the wing pouch. UAS-Sqh clones were generated in the posterior compartment using MARCM. (A) UAS-Sqhwt clones in wing pouch are indistinguishable from wild-type cells. Inset shows close-up of area in rectangle. (B) Cross-section of a UAS-Sqhwt clone showing lack of invagination. (C) Clone cells overexpressing a phosphomimetic form of Sqh (SqhEE) invaginate. (C’) optical projection of area in rectangle in C showing apical constriction. (C’’) Close-up of area in rectangle in C’. (D) Cross-section of an invaginated UAS-SqhEE clone. (E,H) Expression of non-phosphorylatable Sqh (UAS-SqhAA) in cells wild type for APC results in weak apical expansion. (F, H) Apical constriction is suppressed in APC null clones expressing SqhAA. (G) Apically constricted APC null clone. (H) Comparison of average apical cell surface area ratios in indicated genotypes. Scale bars: 10 µm in A, C, C’, E–G; 5 µm in inset in A, B, C”, D.
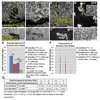
Fig. 8
Apical constriction in APC null clones requires Rho1. Late 3rd larval instar wing discs. (A-B’) Larvae were maintained at 18°C after clone induction. (A, A’) UAS-Rho1N19/+;+/+ clone (driven by en-GAL4 using MARCM) showing severe apical expansion (A) and abnormally large nuclei [propidium iodide (P.I.)] (A’). Yellow line indicates clone border. (B, B’) APC null clones expressing UAS-Rho1N19 display weak apical expansion (B, yellow lines, arrows), and primarily normal sized nuclei (B’, arrow, compared with wild type nuclei in inset). Occasional abnormally large nuclei are observed (B’, arrowhead). (C–D) Larvae were maintained at 21–23°C after clone induction. (C-C”) APC null clone expressing UAS-Rho1dsRNA, driven by en-GAL4 using MARCM, marked by reduced Rho1 (C) and nuclear GFP (C”). Cells are apically expanded (C’), but have normal nucleus sizes compared to wild type nuclei in the same disc location (compare C” with D). (E) Comparison of apical cell surface area ratios in indicated genotypes. (F) Comparison of nucleus size ratios (mutant/wild type as inferred from measuring area, see Methods) in indicated genotypes. (G) Proportion of cells of the indicated genotypes in abnormal nucleus size categories. Statistically significant trend shows proportion of UAS-Rho1N19/+; +/+ cells increases as nucleus size increases. Scale bars: 10 µm.
Similar articles
- Dpp signaling promotes the cuboidal-to-columnar shape transition of Drosophila wing disc epithelia by regulating Rho1.
Widmann TJ, Dahmann C. Widmann TJ, et al. J Cell Sci. 2009 May 1;122(Pt 9):1362-73. doi: 10.1242/jcs.044271. Epub 2009 Apr 14. J Cell Sci. 2009. PMID: 19366729 - Testing hypotheses for the functions of APC family proteins using null and truncation alleles in Drosophila.
McCartney BM, Price MH, Webb RL, Hayden MA, Holot LM, Zhou M, Bejsovec A, Peifer M. McCartney BM, et al. Development. 2006 Jun;133(12):2407-18. doi: 10.1242/dev.02398. Development. 2006. PMID: 16720878 - Modular activation of Rho1 by GPCR signalling imparts polarized myosin II activation during morphogenesis.
Kerridge S, Munjal A, Philippe JM, Jha A, de las Bayonas AG, Saurin AJ, Lecuit T. Kerridge S, et al. Nat Cell Biol. 2016 Mar;18(3):261-70. doi: 10.1038/ncb3302. Epub 2016 Jan 18. Nat Cell Biol. 2016. PMID: 26780298 - The adenomatous polyposis coli tumor suppressor and Wnt signaling in the regulation of apoptosis.
Benchabane H, Ahmed Y. Benchabane H, et al. Adv Exp Med Biol. 2009;656:75-84. doi: 10.1007/978-1-4419-1145-2_7. Adv Exp Med Biol. 2009. PMID: 19928354 Free PMC article. Review. - Functions of the APC tumor suppressor protein dependent and independent of canonical WNT signaling: implications for therapeutic targeting.
Hankey W, Frankel WL, Groden J. Hankey W, et al. Cancer Metastasis Rev. 2018 Mar;37(1):159-172. doi: 10.1007/s10555-017-9725-6. Cancer Metastasis Rev. 2018. PMID: 29318445 Free PMC article. Review.
Cited by
- Actomyosin contractility modulates Wnt signaling through adherens junction stability.
Hall ET, Hoesing E, Sinkovics E, Verheyen EM. Hall ET, et al. Mol Biol Cell. 2019 Feb 1;30(3):411-426. doi: 10.1091/mbc.E18-06-0345. Epub 2018 Dec 12. Mol Biol Cell. 2019. PMID: 30540525 Free PMC article. - Genome-wide DNA methylation profiling reveals cancer-associated changes within early colonic neoplasia.
Hanley MP, Hahn MA, Li AX, Wu X, Lin J, Wang J, Choi AH, Ouyang Z, Fong Y, Pfeifer GP, Devers TJ, Rosenberg DW. Hanley MP, et al. Oncogene. 2017 Aug 31;36(35):5035-5044. doi: 10.1038/onc.2017.130. Epub 2017 May 1. Oncogene. 2017. PMID: 28459462 Free PMC article. - Fold formation at the compartment boundary of Drosophila wing requires Yki signaling to suppress JNK dependent apoptosis.
Liu S, Sun J, Wang D, Pflugfelder GO, Shen J. Liu S, et al. Sci Rep. 2016 Nov 29;6:38003. doi: 10.1038/srep38003. Sci Rep. 2016. PMID: 27897227 Free PMC article. - miR-8 modulates cytoskeletal regulators to influence cell survival and epithelial organization in Drosophila wings.
Bolin K, Rachmaninoff N, Moncada K, Pula K, Kennell J, Buttitta L. Bolin K, et al. Dev Biol. 2016 Apr 1;412(1):83-98. doi: 10.1016/j.ydbio.2016.01.041. Epub 2016 Feb 21. Dev Biol. 2016. PMID: 26902111 Free PMC article. - Interface Contractility between Differently Fated Cells Drives Cell Elimination and Cyst Formation.
Bielmeier C, Alt S, Weichselberger V, La Fortezza M, Harz H, Jülicher F, Salbreux G, Classen AK. Bielmeier C, et al. Curr Biol. 2016 Mar 7;26(5):563-74. doi: 10.1016/j.cub.2015.12.063. Epub 2016 Feb 4. Curr Biol. 2016. PMID: 26853359 Free PMC article.
References
- Ahmed Y, Hayashi S, Levine A, Wieschaus E. Regulation of armadillo by a Drosophila APC inhibits neuronal apoptosis during retinal development. Cell. 1998;93:1171–1182. - PubMed
- Ahmed Y, Nouri A, Wieschaus E. Drosophila Apc1 and Apc2 regulate Wingless transduction throughout development. Development. 2002;129:1751–1762. - PubMed
- Akong K, Grevengoed EE, Price MH, McCartney BM, Hayden MA, DeNofrio JC, Peifer M. Drosophila APC2 and APC1 play overlapping roles in wingless signaling in the embryo and imaginal discs. Dev Biol. 2002;250:91–100. - PubMed
- Bate M, Martinez Arias A. The Development of Drosophila melanogaster. Vol. 2. Plainview, NY: Cold Spring Harbor Laboratory Press; 1993. p. 1558.
- Bate M, Rushton E. Myogenesis and muscle patterning in Drosophila. C R Acad Sci III. 1993;316:1047–1061. - PubMed
Publication types
MeSH terms
Substances
LinkOut - more resources
Full Text Sources
Molecular Biology Databases
Miscellaneous


