Endogenous Nmnat2 is an essential survival factor for maintenance of healthy axons - PubMed (original) (raw)
Endogenous Nmnat2 is an essential survival factor for maintenance of healthy axons
Jonathan Gilley et al. PLoS Biol. 2010.
Abstract
The molecular triggers for axon degeneration remain unknown. We identify endogenous Nmnat2 as a labile axon survival factor whose constant replenishment by anterograde axonal transport is a limiting factor for axon survival. Specific depletion of Nmnat2 is sufficient to induce Wallerian-like degeneration of uninjured axons which endogenous Nmnat1 and Nmnat3 cannot prevent. Nmnat2 is by far the most labile Nmnat isoform and is depleted in distal stumps of injured neurites before Wallerian degeneration begins. Nmnat2 turnover is equally rapid in injured Wld(S) neurites, despite delayed neurite degeneration, showing it is not a consequence of degeneration and also that Wld(S) does not stabilize Nmnat2. Depletion of Nmnat2 below a threshold level is necessary for axon degeneration since exogenous Nmnat2 can protect injured neurites when expressed at high enough levels to overcome its short half-life. Furthermore, proteasome inhibition slows both Nmnat2 turnover and neurite degeneration. We conclude that endogenous Nmnat2 prevents spontaneous degeneration of healthy axons and propose that, when present, the more long-lived, functionally related Wld(S) protein substitutes for Nmnat2 loss after axon injury. Endogenous Nmnat2 represents an exciting new therapeutic target for axonal disorders.
Conflict of interest statement
The authors and host institution have a patent pending related to this work.
Figures
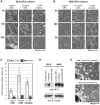
Figure 1. Protein synthesis suppression induces rapid Wallerian-like degeneration of SCG neurites before loss of neuronal viability.
Representative bright-field images of distal neurites from wild-type (BL/6) (A) and Wld S (B) mouse SCG explant cultures treated with 1 or 10 µg/ml CHX or 10 µM emetine as indicated. Images of the same field of distal neurites were captured at the times indicated on the left. Neurites in DMSO-treated wild-type cultures continue to grow and appear morphologically normal (unpublished data). (C) The fold increase in neurite blebs 12 h after treatment with CHX or emetine in BL/6 cultures and 48 h after treatment in Wld S cultures, relative to the same neurites at the start of the treatment (0 h), was quantified from three or more independent experiments combining data from multiple fields (error bars = ±S.E.M.). Blebbing is significantly reduced in Wld S cultures even at this much later time point (*p<0.05, **p = 0.01, t test Wld S at 48 h versus BL/6 at 12 h). (D) Anti-NF-H and anti-ß-Tubulin immunoblots of neurite-only extracts from wild-type or Wld S SCG explant cultures either treated with 10 µM emetine for 8 h, left untreated, or 8 h after cut. Each lane represents neurites collected from SCG cultures containing three ganglia. (E) Bright-field images of a mouse SCG explant after 7 d of treatment with 1 µg/ml CHX and 7 d after CHX removal. Images are representative of three independent experiments.
Figure 2. Neurites degenerate when suppression of protein synthesis is restricted to the cell body.
(A) Diagram showing the organization of compartmented wild-type mouse SCG cultures. (B) Representative bright-field images of distal neurites from the side chamber of a compartmented culture in which 10 µM emetine was added to either the central chamber (cell bodies treated) or side chamber (neurites treated). Images of the same field of neurites were captured just after emetine addition (0 h) and 24 h later. The fold increase in blebbing at 24 h relative to 0 h (of the same neurites) was quantified from three independent experiments combining data from multiple fields (error bars = ±S.E.M.) and is shown on the right. Treatment of cell bodies (CB) alone induces significantly more blebbing of distal neurites than treatment of the distal neurites (N) themselves (*p = 0.026, t test). Comparable results were obtained with 1 µg/ml CHX (unpublished data).
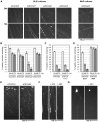
Figure 3. The Nmnat siRNA pools are specific for their intended targets.
(A) Each Nmnat siRNA pool specifically blocks expression of a FLAG-tagged version of its intended target in transfected HEK 293T cells. Representative FLAG immunoblot of cells 24 h after co-transfection with expression vectors for each FLAG-Nmnat isoform together with a non-targeting pool of siRNA (si_Control_) or one of the si_Nmnat_ siRNA pools as indicated. Quantification of band intensities relative to bands in the si_Control_ lane in three independent experiments is shown on the right (error bars = ±S.E.M.). Each siRNA pool specifically and significantly reduces expression of its target (***p<0.001, t test of respective si_Nmnat_ versus si_Control_). Each FLAG-Nmnat acts as internal control of transfection efficiency for the others. Only 3/4 of the pooled Nmnat2 siRNAs and 2/4 of the pooled Nmnat3 siRNAs target sequences in the respective expression vectors (compared to 4/4 for the Nmnat1 siRNA pool). All should target the endogenous mRNAs. (B) Each Nmnat siRNA pool specifically blocks expression of a FLAG-tagged version of its intended target in injected SCG neurons. Representative fluorescent images of SCG neurons 48 h after co-injection with one FLAG-Nmnat expression vector, pEGFP-C1, and the relevant si_Nmnat_ pool or non-targeting siRNA pool (si_Control_). eGFP fluorescence identifies injected neurons, FLAG immunostaining shows expression levels of each FLAG-Nmnat, and DAPI labels nuclei. Each si_Nmnat_ siRNA pool significantly reduces expression of its target isoform compared to si_Control_ as indicated on the right by quantification of FLAG immunostaining relative to eGFP fluorescence in individual neurons (**p<0.01, ***p<0.001, t test of respective si_Nmnat_ versus si_Control_). Data are from three independent experiments in which at total of 36–55 injected neurons were analyzed (error bars = ±S.E.M.) Localization of each tagged isoform is consistent with their expected distribution; Nmnat1 in nuclei and Nmnat2 and Nmnat3 in cytoplasmic compartments.
Figure 4. Nmnat2 siRNA triggers Wallerian-like degeneration of SCG neurites.
(A) Representative fluorescent images of the distal ends of (DsRed2-labeled) neurites of wild-type (BL/6) or Wld S SCG neurons 24 and 72 h after injection with non-targeting siRNA (si_Control_) or siRNA targeting each Nmnat isoform (si_Nmnat1_, 2, or 3), as indicated, together with pDsRed2-N1 (50 ng/µl) (see also Figure S4). (B) Relative survival of (DsRed2-labeled) neurites of wild-type SCG neurons injected with si_Control_, si_Nmnat1_, si_Nmnat2_, or si_Nmnat3_. The number of healthy DsRed2-labeled neurites remaining at each time point is shown as a percentage of the total number (both healthy and abnormal) 24 h after injection and was quantified from three independent experiments combining data from multiple fields (error bars = ±S.E.M.). Only si_Nmnat2_ causes significant neurite loss (**p<0.01, ***p<0.001, t test si_Nmnat2_ versus si_Control_ at equivalent time points). (C) Co-injection of si_Nmnat1_, 2, and 3 (each at 100 ng/µl) does not accelerate (wild-type) neurite loss compared to injection of si_Nmnat2_ alone (100 ng/µl). Data were quantified as in (B) from three independent experiments (error bars = ±S.E.M.). (D) Neurite loss caused by si_Nmnat2_ injection is abolished in Wld S SCG neurons up to 72 h after injection (**p<0.01, ***p<0.001, t test Wld S versus BL/6 at equivalent time points). Data were quantified as in (B) from four independent experiments (error bars = ±S.E.M.). (E–G) Representative fluorescent images showing the typical characteristics of the neurite degeneration caused by si_Nmnat2_ injection. Multiple DsRed2-positive neuritic swellings are only observed after si_Nmnat2_ injection (E) and these precede a characteristic progressive distal-to-proximal “dying-back” neurite degeneration (F). Neurites showing “dying-back” degeneration can be followed back to morphologically normal cell bodies. This contrasts the more rapid, catastrophic neurite degeneration that coincides with cell body death (G) and is seen following injection of all siRNA pools (including si_Control_). Images in (E) were captured 48 h after injection and show injected cell bodies at the top of each panel.
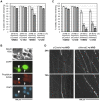
Figure 5. Neurite degeneration following si_Nmnat2_ injection precedes loss of neuronal viability.
(A) Viability of wild-type SCG neurons injected with non-targeting siRNA (si_Control_) or Nmnat2 siRNA (si_Nmnat2_), together with pEGFP-C1 (10 ng/µl), and treated with 50 µM z-VAD-fmk or vehicle (DMSO) as indicated. The number of neurons with normal gross morphology remaining at each time point is shown as a percentage of those present at 24 h and was quantified from three independent experiments (error bars = ±S.E.M.). There is a small but significant decrease in the percentage of viable neurons 48 and 72 h after injection with si_Nmnat2_ (+DMSO) relative to si_Control_ (***p<0.001, t test si_Nmnat2_ versus si_Control_ at equivalent time points), but this is reduced to control levels following treatment with z-VAD-fmk. (B) Assessment of neuronal viability based on gross morphology matches that based on other indicators of viability. At the end of experiments in (A), neurons were counter-stained with propidium iodide (PI), a DNA stain that can only penetrate the membranes of non-viable cells, and DAPI. Abnormal gross morphology seen with bright-field and eGFP imaging correlated precisely with PI staining and nuclear condensation/fragmentation (revealed by DAPI staining) typical of cell death. An arrowhead indicates an abnormal neuron (rarely seen in these experiments) and an arrow a healthy neuron. (C) Quantification of neurite survival corresponding to the analysis of neuronal viability in (A). The number of healthy eGFP-labelled neurites remaining at each time point (quantified from multiple fields in each experiment) is shown as a percentage of the total number (both healthy and abnormal) 24 h after injection (error bars = ±S.E.M.). Significant neurite loss is seen following si_Nmnat2_ injection irrespective of treatment with z-VAD-fmk (*p<0.05, **p<0.01, ***p<0.001, t test si_Nmnat2_ ± z-VAD-fmk versus si_Control_ ± z-VAD-fmk at equivalent time points) with no significant difference between the two. (D) Representative fluorescent images of the distal ends of eGFP-labelled neurites of wild-type (BL/6) SCG neurons 24 and 72 h after injection with si_Control_ or si_Nmnat2_ and treated with z-VAD-fmk.
Figure 6. Nmnat2 is the most labile Nmnat isoform and is degraded by the proteasome.
(A) Relative stabilities of FLAG-tagged Nmnat isoforms and WldS in HEK 293T cells co-transfected with expression vectors for each and treated 24 h after transfection with 10 µM emetine to block translation for the times indicated. A representative FLAG immunoblot is shown (top panel). The same blot was re-probed with an Nmnat2 antibody (bottom panel) to show that loss of anti-FLAG signal is primarily due to protein turnover rather than cleavage of the FLAG epitope from the protein. Quantification of band intensities for each protein from three independent experiments is shown below as a percentage of untreated (0 h) band intensities (error bars = ±S.E.M.). Co-transfection allows direct comparison of stabilities of each protein in the same cells. (B) FLAG-Nmnat2 turnover in transfected HEK 293T cells is prevented by proteasome inhibition. Cells were transfected as in (A) and treated with 10 µM emetine for 0 or 24 h, ±20 µM MG-132. A FLAG immunoblot representative of three independent experiments is shown. (C) Endogenous Nmnat2 is rapidly turned over in SCG explant cultures after blocking translation with CHX (1 µg/ml) or emetine (10 µM). Representative immunoblots are shown comparing steady-state levels of Nmnat2 (0 h) with levels after 4 h of protein synthesis suppression. ß-Tubulin acts as a loading control. Nmnat2 band intensity at 4 h is shown as a fraction of that at 0 h after normalization to ß-Tubulin and was quantified from two independent experiments each (error bars = ±S.E.M.). These values are consistent with the different rates at which CHX (1 µg/ml) and emetine induce neurite degeneration (Figure 1).
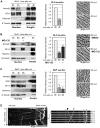
Figure 7. Endogenous Nmnat2 is present in SCG neurites and undergoes rapid turnover after transection.
(A–C) Relationship between Nmnat2 turnover in neurites and other parameters of neurite health in wild-type cultures (A), wild-type cultures ±20 µM MG-132 (B), and Wld S cultures (C). Representative immunoblots show detection of Nmnat2, WldS (where applicable), NF-H, 16 kDa core Histones, and ß-Tubulin just after cut (0 h) and 4 and/or 8 h later. Material collected from SCG explant cultures derived from 15–20 ganglia was needed to detect Nmnat2 in each lane. Loss of the NF-H band is an early consequence of axon degeneration and absence of the 16 kDa core Histones band in neurite extracts confirms there is no detectable contamination with SCG cell bodies or non-neuronal cells. ß-Tubulin represents a loading control. Relative Nmnat2 band intensities in neurite-only lanes are shown as a fraction of levels at 0 h after normalisation to ß-Tubulin and were quantified from two or three independent experiments (error bars = ±S.E.M.). Nmnat2 is significantly depleted in untreated wild-type and Wld S neurites shortly after separation from their ganglia (*p<0.05, **p<0.01, ***p<0.001, t test 4 or 8 h versus 0 h). Proteasome inhibition with MG-132 significantly reduces this Nmnat2 loss at 8 h after transection (§§ p<0.01, t test 8 h +MG-132 versus 8 h untreated). Images show representative transected neurite morphology (in the same field where applicable) at the indicated times after cut. (D) Kymograph of the bottom axon in Video S1 showing fast axonal transport of particles containing Nmnat2-eGFP with a bias in the anterograde direction. An image series from the indicated region of the kymograph is shown on the right. It highlights a particle moving anterogradely (filled arrowhead), one moving retrogradely (empty arrowhead), and several stationary particles (asterisks).
Figure 8. Exogenous Nmnat2 protects transected neurites for prolonged periods only when highly overexpressed.
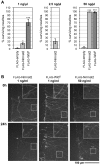
(A) Protection of transected neurites by exogenous expression of FLAG-Nmnat2 or FLAG-WldS (see also Figure S9). SCG neurons injected with 1, 2.5, or 50 ng/µl empty vector (FLAG-empty) or FLAG-Nmnat2 or FLAG-WldS expression vectors, together with pDsRed2-N1 (50 ng/µl), were transected 48 h later. Survival of DsRed2-labeled neurites 24 h after transection is shown as a percentage of the number of labelled neurites with normal morphology just after cut (0 h) and was quantified from two to four independent experiments combining data from multiple fields (error bars = ±S.E.M). FLAG-WldS protects neurites significantly better than FLAG-Nmnat2 24 h after cut at the 1 ng/µl vector concentration (***p<0.001, t test). There is no significant difference in protection 24 h after transection at the 50 ng/µl vector concentration. (B) Representative fluorescent images of transected DsRed2-labeled neurites of SCG neurons injected with selected concentrations of FLAG-Nmnat2 or FLAG-WldS expression vectors (as indicated). The same field of neurites is shown at the time of cut (0 h) and 24 h later. The cut site is located to the left of each image. Increased magnification of the framed region in each panel is shown for better visualization of neurite morphology.
Similar articles
- Rescue of peripheral and CNS axon defects in mice lacking NMNAT2.
Gilley J, Adalbert R, Yu G, Coleman MP. Gilley J, et al. J Neurosci. 2013 Aug 14;33(33):13410-24. doi: 10.1523/JNEUROSCI.1534-13.2013. J Neurosci. 2013. PMID: 23946398 Free PMC article. - Axonal trafficking of NMNAT2 and its roles in axon growth and survival in vivo.
Milde S, Gilley J, Coleman MP. Milde S, et al. Bioarchitecture. 2013 Sep-Dec;3(5):133-40. doi: 10.4161/bioa.27049. Epub 2013 Nov 7. Bioarchitecture. 2013. PMID: 24284888 Free PMC article. - Subcellular localization determines the stability and axon protective capacity of axon survival factor Nmnat2.
Milde S, Gilley J, Coleman MP. Milde S, et al. PLoS Biol. 2013;11(4):e1001539. doi: 10.1371/journal.pbio.1001539. Epub 2013 Apr 16. PLoS Biol. 2013. PMID: 23610559 Free PMC article. - Wld(S), Nmnats and axon degeneration--progress in the past two decades.
Feng Y, Yan T, He Z, Zhai Q. Feng Y, et al. Protein Cell. 2010 Mar;1(3):237-45. doi: 10.1007/s13238-010-0021-2. Epub 2010 Feb 23. Protein Cell. 2010. PMID: 21203970 Free PMC article. Review. - Wallerian degeneration, wld(s), and nmnat.
Coleman MP, Freeman MR. Coleman MP, et al. Annu Rev Neurosci. 2010;33:245-67. doi: 10.1146/annurev-neuro-060909-153248. Annu Rev Neurosci. 2010. PMID: 20345246 Free PMC article. Review.
Cited by
- Local translatome sustains synaptic function in impaired Wallerian degeneration.
Paglione M, Restivo L, Zakhia S, Llobet Rosell A, Terenzio M, Neukomm LJ. Paglione M, et al. EMBO Rep. 2024 Oct 31. doi: 10.1038/s44319-024-00301-8. Online ahead of print. EMBO Rep. 2024. PMID: 39482489 - The Physiologic Basis of Molecular Therapeutics for Peripheral Nerve Injury: A Primer.
Spezia MC, Dy CJ, Brogan DM. Spezia MC, et al. J Hand Surg Glob Online. 2024 Mar 26;6(5):676-680. doi: 10.1016/j.jhsg.2024.01.017. eCollection 2024 Sep. J Hand Surg Glob Online. 2024. PMID: 39381384 Free PMC article. Review. - Chronically Low NMNAT2 Expression Causes Sub-lethal SARM1 Activation and Altered Response to Nicotinamide Riboside in Axons.
Antoniou C, Loreto A, Gilley J, Merlini E, Orsomando G, Coleman MP. Antoniou C, et al. Mol Neurobiol. 2024 Oct 1. doi: 10.1007/s12035-024-04480-2. Online ahead of print. Mol Neurobiol. 2024. PMID: 39352636 - Biological Functions and Therapeutic Potential of NAD+ Metabolism in Gynecological Cancers.
Myong S, Nguyen AQ, Challa S. Myong S, et al. Cancers (Basel). 2024 Sep 5;16(17):3085. doi: 10.3390/cancers16173085. Cancers (Basel). 2024. PMID: 39272943 Free PMC article. Review. - Advances in the Synthesis and Physiological Metabolic Regulation of Nicotinamide Mononucleotide.
Zheng C, Li Y, Wu X, Gao L, Chen X. Zheng C, et al. Nutrients. 2024 Jul 20;16(14):2354. doi: 10.3390/nu16142354. Nutrients. 2024. PMID: 39064797 Free PMC article. Review.
References
- Araki T, Sasaki Y, Milbrandt J. Increased nuclear NAD biosynthesis and SIRT1 activation prevent axonal degeneration. Science. 2004;305:1010–1013. - PubMed
- Conforti L, Fang G, Beirowski B, Wang M. S, Sorci L, et al. NAD(+) and axon degeneration revisited: Nmnat1 cannot substitute for WldS to delay Wallerian degeneration. Cell Death Differ. 2007;14:116–127. - PubMed
Publication types
MeSH terms
Substances
LinkOut - more resources
Full Text Sources
Other Literature Sources
Molecular Biology Databases
