U87MG decoded: the genomic sequence of a cytogenetically aberrant human cancer cell line - PubMed (original) (raw)
U87MG decoded: the genomic sequence of a cytogenetically aberrant human cancer cell line
Michael James Clark et al. PLoS Genet. 2010.
Erratum in
- Correction: U87MG Decoded: The Genomic Sequence of a Cytogenetically Aberrant Human Cancer Cell Line.
Clark MJ, Homer N, O'Connor BD, Chen Z, Eskin A, Lee H, Merriman B, Nelson SF. Clark MJ, et al. PLoS Genet. 2018 May 16;14(5):e1007392. doi: 10.1371/journal.pgen.1007392. eCollection 2018 May. PLoS Genet. 2018. PMID: 29768410 Free PMC article.
Abstract
U87MG is a commonly studied grade IV glioma cell line that has been analyzed in at least 1,700 publications over four decades. In order to comprehensively characterize the genome of this cell line and to serve as a model of broad cancer genome sequencing, we have generated greater than 30x genomic sequence coverage using a novel 50-base mate paired strategy with a 1.4kb mean insert library. A total of 1,014,984,286 mate-end and 120,691,623 single-end two-base encoded reads were generated from five slides. All data were aligned using a custom designed tool called BFAST, allowing optimal color space read alignment and accurate identification of DNA variants. The aligned sequence reads and mate-pair information identified 35 interchromosomal translocation events, 1,315 structural variations (>100 bp), 191,743 small (<21 bp) insertions and deletions (indels), and 2,384,470 single nucleotide variations (SNVs). Among these observations, the known homozygous mutation in PTEN was robustly identified, and genes involved in cell adhesion were overrepresented in the mutated gene list. Data were compared to 219,187 heterozygous single nucleotide polymorphisms assayed by Illumina 1M Duo genotyping array to assess accuracy: 93.83% of all SNPs were reliably detected at filtering thresholds that yield greater than 99.99% sequence accuracy. Protein coding sequences were disrupted predominantly in this cancer cell line due to small indels, large deletions, and translocations. In total, 512 genes were homozygously mutated, including 154 by SNVs, 178 by small indels, 145 by large microdeletions, and 35 by interchromosomal translocations to reveal a highly mutated cell line genome. Of the small homozygously mutated variants, 8 SNVs and 99 indels were novel events not present in dbSNP. These data demonstrate that routine generation of broad cancer genome sequence is possible outside of genome centers. The sequence analysis of U87MG provides an unparalleled level of mutational resolution compared to any cell line to date.
Conflict of interest statement
The authors have declared that no competing interests exist.
Figures
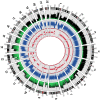
Figure 1. SNP chip and base sequence coverage compared.
Circos was used to plot base sequence coverage from ABI sequencing as a histogram (the outermost plot, green and black) alongside dot plots of the LogR-ratio (middle plot, blue) and B-allele frequency (innermost plot, red) from the Illumina Human 1M Duo BeadChip microarray. LogR-ratio represents copy number (CN) and B-allele frequency represents loss of heterozygosity (LOH).
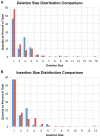
Figure 2. Small insertion/deletion size distribution.
(A) Distribution of small deletion sizes as a percent of total, comparing amino-acid encoding deletions (blue) with non-coding deletions (red). (B) Distribution of small insertion sizes as a percent of total, comparing amino-acid encoding insertions (blue) with non-coding insertions (red).
Figure 3. Base substitution frequencies.
Ratio of specific nucleotide substitutions as a percent of total single nucleotide variants, comparing SNVs in coding regions (blue) to SNVs genome-wide (red).
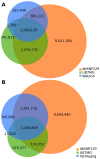
Figure 4. Individual genome comparison.
(A) Venn diagram showing overlap in SNVs among the U87 genome, the Watson genome, and dbSNP 129. (B) Venn diagram showing overlap in SNVs among the U87 genome, the YanHuang genome, and dbSNP 129.
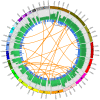
Figure 5. Structural variations in U87MG.
Structural variations detected by whole genome sequencing in the U87MG genome are plotted in the Circos program. Orange lines linking two chromosomes represent the 35 interchromosomal translocations. Blue lines around the edge of the circle represent microdeletions and intrachromosomal translocations. The outermost histogram represents sequence coverage and demonstrates how the boundaries of changes in coverage typically coincide with a significant structural variation.
Figure 6. Reads spanning interchromosomal translocation breakpoints.
Two genomic breakpoint events are highlighted between chromosomes 2 and 16. The outer ring represents the chromosomes displaying tick marks every 100 bases. The green plot shows base-coverage for each position. Each orange line represents a single mate-pair as a link between one end of a read and its mate-pair. Between the breakpoints on each chromosome (chr2:56792000–56953300 and chr16:8826200–8826700), base coverage drops to about half of what it is on the other side of the event, from two to one copy. This suggests an interchromosomal translocation between chromosomes 2 and 16 resulting in a loss of the genomic material between the translocation breakpoints.
Figure 7. Increased resolution of structural variations by sequencing.
Resolution of karyotyping and SKY approaches is not high enough to see the complex nature of this translocation event between chr1 and chr16. With high-resolution whole-genome sequencing, the true structure of the translocation is revealed as mutual translocations between a small fragment of chr2 with chr1 and chr16 on either end.
Similar articles
- Sequence and structural variation in a human genome uncovered by short-read, massively parallel ligation sequencing using two-base encoding.
McKernan KJ, Peckham HE, Costa GL, McLaughlin SF, Fu Y, Tsung EF, Clouser CR, Duncan C, Ichikawa JK, Lee CC, Zhang Z, Ranade SS, Dimalanta ET, Hyland FC, Sokolsky TD, Zhang L, Sheridan A, Fu H, Hendrickson CL, Li B, Kotler L, Stuart JR, Malek JA, Manning JM, Antipova AA, Perez DS, Moore MP, Hayashibara KC, Lyons MR, Beaudoin RE, Coleman BE, Laptewicz MW, Sannicandro AE, Rhodes MD, Gottimukkala RK, Yang S, Bafna V, Bashir A, MacBride A, Alkan C, Kidd JM, Eichler EE, Reese MG, De La Vega FM, Blanchard AP. McKernan KJ, et al. Genome Res. 2009 Sep;19(9):1527-41. doi: 10.1101/gr.091868.109. Epub 2009 Jun 22. Genome Res. 2009. PMID: 19546169 Free PMC article. - Whole-genome sequencing is more powerful than whole-exome sequencing for detecting exome variants.
Belkadi A, Bolze A, Itan Y, Cobat A, Vincent QB, Antipenko A, Shang L, Boisson B, Casanova JL, Abel L. Belkadi A, et al. Proc Natl Acad Sci U S A. 2015 Apr 28;112(17):5473-8. doi: 10.1073/pnas.1418631112. Epub 2015 Mar 31. Proc Natl Acad Sci U S A. 2015. PMID: 25827230 Free PMC article. - A probabilistic method for the detection and genotyping of small indels from population-scale sequence data.
Bansal V, Libiger O. Bansal V, et al. Bioinformatics. 2011 Aug 1;27(15):2047-53. doi: 10.1093/bioinformatics/btr344. Epub 2011 Jun 7. Bioinformatics. 2011. PMID: 21653520 Free PMC article. - dbSNP in the detail and copy number complexities.
Day IN. Day IN. Hum Mutat. 2010 Jan;31(1):2-4. doi: 10.1002/humu.21149. Hum Mutat. 2010. PMID: 20024941 Review. - Integrated analysis of whole-genome paired-end and mate-pair sequencing data for identifying genomic structural variations in multiple myeloma.
Yang R, Chen L, Newman S, Gandhi K, Doho G, Moreno CS, Vertino PM, Bernal-Mizarchi L, Lonial S, Boise LH, Rossi M, Kowalski J, Qin ZS. Yang R, et al. Cancer Inform. 2014 Sep 21;13(Suppl 2):49-53. doi: 10.4137/CIN.S13783. eCollection 2014. Cancer Inform. 2014. PMID: 25288879 Free PMC article. Review.
Cited by
- High-resolution mutational profiling suggests the genetic validity of glioblastoma patient-derived pre-clinical models.
Yost SE, Pastorino S, Rozenzhak S, Smith EN, Chao YS, Jiang P, Kesari S, Frazer KA, Harismendy O. Yost SE, et al. PLoS One. 2013;8(2):e56185. doi: 10.1371/journal.pone.0056185. Epub 2013 Feb 18. PLoS One. 2013. PMID: 23441165 Free PMC article. - Interplay of microRNAs, transcription factors and target genes: linking dynamic expression changes to function.
Nazarov PV, Reinsbach SE, Muller A, Nicot N, Philippidou D, Vallar L, Kreis S. Nazarov PV, et al. Nucleic Acids Res. 2013 Mar 1;41(5):2817-31. doi: 10.1093/nar/gks1471. Epub 2013 Jan 17. Nucleic Acids Res. 2013. PMID: 23335783 Free PMC article. - Mutations in the PCNA-binding domain of CDKN1C cause IMAGe syndrome.
Arboleda VA, Lee H, Parnaik R, Fleming A, Banerjee A, Ferraz-de-Souza B, Délot EC, Rodriguez-Fernandez IA, Braslavsky D, Bergadá I, Dell'Angelica EC, Nelson SF, Martinez-Agosto JA, Achermann JC, Vilain E. Arboleda VA, et al. Nat Genet. 2012 May 27;44(7):788-92. doi: 10.1038/ng.2275. Nat Genet. 2012. PMID: 22634751 Free PMC article. - Recurrent somatic mutation of FAT1 in multiple human cancers leads to aberrant Wnt activation.
Morris LG, Kaufman AM, Gong Y, Ramaswami D, Walsh LA, Turcan Ş, Eng S, Kannan K, Zou Y, Peng L, Banuchi VE, Paty P, Zeng Z, Vakiani E, Solit D, Singh B, Ganly I, Liau L, Cloughesy TC, Mischel PS, Mellinghoff IK, Chan TA. Morris LG, et al. Nat Genet. 2013 Mar;45(3):253-61. doi: 10.1038/ng.2538. Epub 2013 Jan 27. Nat Genet. 2013. PMID: 23354438 Free PMC article. - Decoding of the surfaceome and endocytome in primary glioblastoma cells identifies potential target antigens in the hypoxic tumor niche.
de Oliveira KG, Bång-Rudenstam A, Beyer S, Boukredine A, Talbot H, Governa V, Johansson MC, Månsson AS, Forsberg-Nilsson K, Bengzon J, Malmström J, Welinder C, Belting M. de Oliveira KG, et al. Acta Neuropathol Commun. 2024 Feb 27;12(1):35. doi: 10.1186/s40478-024-01740-z. Acta Neuropathol Commun. 2024. PMID: 38414005 Free PMC article.
References
- CBTRUS 2007–2008 Statistical Report: Primary Brain Tumors in the United States Statistical Report, 2000–2004 (Years of Data Collected). 2008. CBTRUS.
- Stupp R, Mason WP, van den Bent MJ, Weller M, Fisher B, et al. Radiotherapy plus concomitant and adjuvant temozolomide for glioblastoma. N Engl J Med. 2005;352:987–996. - PubMed
- Ponten J, Macintyre EH. Long term culture of normal and neoplastic human glia. Acta Pathol Microbiol Scand. 1968;74:465–486. - PubMed
Publication types
MeSH terms
Substances
LinkOut - more resources
Full Text Sources
Other Literature Sources
Research Materials
