Increased brain edema in aqp4-null mice in an experimental model of subarachnoid hemorrhage - PubMed (original) (raw)
Increased brain edema in aqp4-null mice in an experimental model of subarachnoid hemorrhage
M J Tait et al. Neuroscience. 2010.
Abstract
We investigated the role of the glial water channel protein aquaporin-4 in brain edema in a mouse model of subarachnoid hemorrhage in which 30 microl of blood was injected into the basal cisterns. Brain water content, intracranial pressure and neurological score were compared in wildtype and aquaporin-4 null mice. We also measured blood-brain barrier permeability, and the osmotic permeability of the glia limitans, one of the routes of edema elimination. Wildtype and aquaporin-4 null mice had comparable baseline brain water content, intracranial pressure and neurological score. At 6 h after blood injection, aquaporin-4 null mice developed more brain swelling than wildtype mice. Brain water content increased by 1.5+/-0.1% vs. 0.5+/-0.2% (Mean+/-Standard Error, P<0.0005) and intracranial pressure by 36+/-5 vs. 21+/-3 mm Hg (P<0.05) above pre-injection baseline, and neurological score was worse at 18.0 vs. 24.5 (median, P<0.05), respectively. Although subarachnoid hemorrhage produced comparable increases in blood-brain barrier permeability in wildtype and aquaporin-4 null mice, aquaporin-4 null mice had a twofold reduction in glia limitans osmotic permeability. We conclude that aquaporin-4 null mice manifest increased brain edema following subarachnoid hemorrhage as a consequence of reduced elimination of excess brain water.
Copyright 2010 IBRO. Published by Elsevier Ltd. All rights reserved.
Figures
Figure 1. Mouse SAH model
A. (Top) Mouse calvarium. Burr hole 1 is for injection and burr hole 2 for ICP monitoring. (Bottom) The injecting needle is advanced 30° to the perpendicular into the basal cisterns. B. Exposed dura overlying cisterna magna and CSF at T6 before and after injecting blood into the basal cisterns. C. ICP traces. Arrowheads show onset of blood injection. Inset 1: prominent respiratory waves. Inset 2: cardiac ICP pulsations. D. Coronal brain section at 2.8 mm from the frontal poles stained with hematoxylin-eosin showing normal-sized 3rd ventricle 24 h after sham injection or SAH. Bar = 0.5 mm. E. Brain sections 24 h after needle insertion (Sham) or SAH. Mice had i.v. injection of 10 kDa rhodamine-dextran (red) and 2 MDa FITC-dextran (green). Bar = 50 µm.
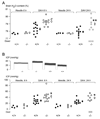
Figure 2. Brain edema after SAH
A. Whole brain water content measured at 6 and 24 h after needle insertion or SAH. B. (Top) Typical ICP recordings from 2 WT and 2 KO mice at 6 h after SAH and (Bottom) summary of ICP data measured at 6 and 24 h after needle insertion or SAH. ● = WT (+/+), ○ = KO (−/−), X = dead mice. ■ = Mean of WT, □ = Mean of KO, Error lines = ±SEM. *P < 0.05, **P < 0.01, #P < 0.0005 for WT vs. KO.
Figure 3. Neurological score after SAH
A. Neurological scale. B. Neurological score at 6 and 24 h after needle insertion or SAH in WT and KO mice. ● = WT (+/+), ○ = KO (−/−), X = dead mice. — = median. *P < 0.05 for WT vs. KO.
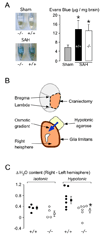
Figure 4. Blood-brain barrier and glia limitans
A. (Left) Mouse brains in formamide. WT (+/+) and KO (−/−) mice had needle insertion (Sham) or SAH. (Right) Summary of Evans blue data. N = 4 (Sham, 2 +/+ and 2 −/−), 3 (SAH, +/+), 3 (SAH, −/− ). Mean ± SEM. *P < 0.05 compared with sham. B. Setup for measuring glia limitans osmotic permeability. C. Difference in % water content between right and left hemispheres (ΔH2O) in WT (●, +/+) and KO (○, −/−) mice exposed to 4 % agarose gel in water (hypotonic) or 0.9 % saline (isotonic). ■ = Mean of WT, □ = Mean of KO, Error lines = ±SEM. *P < 0.02.
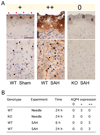
Figure 5. Aqp4 immunoreactivity after SAH
A. (top) Glia limitants and (bottom) basal cerebral cortex. In the sham WT mouse (+, left), red arrows indicate the pia, asterisks the glia limitants, and arrowheads show microvessels. In the WT mouse 24 h after SAH (++, middle), ‘R’ indicates red blood cells overlying the pia, white asterisks the subpial region, arrowheads show microvessels, and black asterisks show aqp4 immunoreactivity in the brain parenchyma. In the KO mouse 24 h after SAH (0, right), ‘R’ indicates red blood cells covering the pia. Bar = 50 µm. B. Summary of immunohistochemical staining, graded as 0, +, ++ as described in A.
Similar articles
- Hydrogen sulfide attenuates brain edema in early brain injury after subarachnoid hemorrhage in rats: Possible involvement of MMP-9 induced blood-brain barrier disruption and AQP4 expression.
Cao S, Zhu P, Yu X, Chen J, Li J, Yan F, Wang L, Yu J, Chen G. Cao S, et al. Neurosci Lett. 2016 May 16;621:88-97. doi: 10.1016/j.neulet.2016.04.018. Epub 2016 Apr 11. Neurosci Lett. 2016. PMID: 27080433 - Aquaporin-4 facilitates reabsorption of excess fluid in vasogenic brain edema.
Papadopoulos MC, Manley GT, Krishna S, Verkman AS. Papadopoulos MC, et al. FASEB J. 2004 Aug;18(11):1291-3. doi: 10.1096/fj.04-1723fje. Epub 2004 Jun 18. FASEB J. 2004. PMID: 15208268 - Aquaporin-4 gene deletion in mice increases focal edema associated with staphylococcal brain abscess.
Bloch O, Papadopoulos MC, Manley GT, Verkman AS. Bloch O, et al. J Neurochem. 2005 Oct;95(1):254-62. doi: 10.1111/j.1471-4159.2005.03362.x. J Neurochem. 2005. PMID: 16181429 - Aquaporin-4 and brain edema.
Papadopoulos MC, Verkman AS. Papadopoulos MC, et al. Pediatr Nephrol. 2007 Jun;22(6):778-84. doi: 10.1007/s00467-006-0411-0. Epub 2007 Mar 9. Pediatr Nephrol. 2007. PMID: 17347837 Free PMC article. Review. - Studies of mdx mice.
Vajda Z, Pedersen M, Doczi T, Sulyok E, Nielsen S. Vajda Z, et al. Neuroscience. 2004;129(4):993-8. doi: 10.1016/j.neuroscience.2004.08.055. Neuroscience. 2004. PMID: 15561414 Review.
Cited by
- Inhibition of Aquaporin 4 Decreases Amyloid Aβ40 Drainage Around Cerebral Vessels.
Rosu GC, Catalin B, Balseanu TA, Laurentiu M, Claudiu M, Kumar-Singh S, Daniel P. Rosu GC, et al. Mol Neurobiol. 2020 Nov;57(11):4720-4734. doi: 10.1007/s12035-020-02044-8. Epub 2020 Aug 11. Mol Neurobiol. 2020. PMID: 32783141 Free PMC article. - Aquaporin-4 Expression during Toxic and Autoimmune Demyelination.
Rohr SO, Greiner T, Joost S, Amor S, Valk PV, Schmitz C, Kipp M. Rohr SO, et al. Cells. 2020 Sep 28;9(10):2187. doi: 10.3390/cells9102187. Cells. 2020. PMID: 32998402 Free PMC article. - A high throughput screen identifies chemical modulators of the laminin-induced clustering of dystroglycan and aquaporin-4 in primary astrocytes.
Noël G, Stevenson S, Moukhles H. Noël G, et al. PLoS One. 2011 Mar 7;6(3):e17559. doi: 10.1371/journal.pone.0017559. PLoS One. 2011. PMID: 21408176 Free PMC article. - Potential contribution of hypoxia-inducible factor-1α, aquaporin-4, and matrix metalloproteinase-9 to blood-brain barrier disruption and brain edema after experimental subarachnoid hemorrhage.
Wang Z, Meng CJ, Shen XM, Shu Z, Ma C, Zhu GQ, Liu HX, He WC, Sun XB, Huo L, Zhang J, Chen G. Wang Z, et al. J Mol Neurosci. 2012 Sep;48(1):273-80. doi: 10.1007/s12031-012-9769-6. Epub 2012 Apr 22. J Mol Neurosci. 2012. PMID: 22528459 - Persistent Malfunction of Glymphatic and Meningeal Lymphatic Drainage in a Mouse Model of Subarachnoid Hemorrhage.
Pu T, Zou W, Feng W, Zhang Y, Wang L, Wang H, Xiao M. Pu T, et al. Exp Neurobiol. 2019 Feb;28(1):104-118. doi: 10.5607/en.2019.28.1.104. Epub 2019 Feb 28. Exp Neurobiol. 2019. PMID: 30853828 Free PMC article.
References
- Badaut J, Brunet JF, Grollimund L, Hamou MF, Magistretti PJ, Villemure JG, Regli L. Aquaporin 1 and aquaporin 4 expression in human brain after subarachnoid hemorrhage and in peritumoral tissue. Acta Neurochir Suppl. 2003;86:495–498. - PubMed
- Barry KJ, Gogjian MA, Stein BM. Small animal model for investigation of subarachnoid hemorrhage and cerebral vasospasm. Stroke. 1979;10:538–541. - PubMed
- Bloch O, Auguste KI, Manley GT, Verkman AS. Accelerated progression of kaolin-induced hydrocephalus in aquaporin-4-deficient mice. J Cereb Blood Flow Metab. 2006;26:1527–1537. - PubMed
- Bloch O, Papadopoulos MC, Manley GT, Verkman AS. Aquaporin-4 gene deletion in mice increases focal edema associated with staphylococcal brain abscess. J Neurochem. 2005;95:254–262. - PubMed
Publication types
MeSH terms
Substances
LinkOut - more resources
Full Text Sources
Other Literature Sources
Molecular Biology Databases


