MYC regulation of a "poor-prognosis" metastatic cancer cell state - PubMed (original) (raw)
. 2010 Feb 23;107(8):3698-703.
doi: 10.1073/pnas.0914203107. Epub 2010 Feb 4.
Ben S Wittner, Daniel Irimia, Richard J Flavin, Mathieu Lupien, Ruwanthi N Gunawardane, Clifford A Meyer, Eric S Lightcap, Pablo Tamayo, Jill P Mesirov, X Shirley Liu, Toshi Shioda, Mehmet Toner, Massimo Loda, Myles Brown, Joan S Brugge, Sridhar Ramaswamy
Affiliations
- PMID: 20133671
- PMCID: PMC2840447
- DOI: 10.1073/pnas.0914203107
MYC regulation of a "poor-prognosis" metastatic cancer cell state
Anita Wolfer et al. Proc Natl Acad Sci U S A. 2010.
Abstract
Gene expression signatures are used in the clinic as prognostic tools to determine the risk of individual patients with localized breast tumors developing distant metastasis. We lack a clear understanding, however, of whether these correlative biomarkers link to a common biological network that regulates metastasis. We find that the c-MYC oncoprotein coordinately regulates the expression of 13 different "poor-outcome" cancer signatures. In addition, functional inactivation of MYC in human breast cancer cells specifically inhibits distant metastasis in vivo and invasive behavior in vitro of these cells. These results suggest that MYC oncogene activity (as marked by "poor-prognosis" signature expression) may be necessary for the translocation of poor-outcome human breast tumors to distant sites.
Conflict of interest statement
The authors declare no conflict of interest.
Figures
Fig. 1.
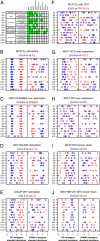
Molecular regulation of 13 poor-outcome human cancer signatures. (A) Thirteen different signatures (designated s1–s13), correlated with different biological processes associated with metastatic progression, reported to be prognostic in different tumor types (green). To simplify the analysis, we first created two “metagenes” by separately averaging up-regulated and down-regulated genes from each multigene poor-outcome cancer signature (s1–s13). (B_–_J) Plots displaying UP and DOWN metagenes derived from each signature in standard deviation units after (B) 17β-estradiol stimulation (red circles) versus control (blue diamonds) in MCF7 cells, (C) ERBB2 overexpression (red circles) versus control (blue diamonds) in MCF10A cells, (D) EGF stimulation (red circles) versus control (blue diamonds) in MCF10A cells, (E) DHT stimulation (red circles) versus control (blue diamonds) in LNCaP cells, (F) 17β-estradiol stimulation and CHX treatment (red circles) versus CHX treatment alone (blue diamonds) in MCF7 cells, (G) overexpression of MYC (red circles) versus vector control (blue diamonds) in MCF7 cells, (H) overexpression of ZIP (red circles) versus vector control (blue diamonds) in MCF7 cells, (I) siRNA knockdown of endogenous MYC (red circles) versus vector control (blue diamonds) in MCF7 cells, and (J) siRNA knockdown of endogenous MYC (red circles) versus vector control (blue diamonds) in MDA-MB-231 cells. Circles and diamonds represent independent replicates. s2, s7, and s9 are unidirectional signatures that have only up-regulated genes.
Fig. 2.
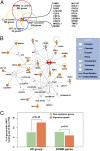
MYC-centered core interactome. (A) Venn diagram illustrating derivation of the core gene set. (B) A highly connected network of the 20 genes in the core gene set (orange) and 13 associated genes identified using the IPA algorithm (17). MYC is highlighted in red. (C) Statistical analysis of genome-wide MYC-binding site data obtained from MCF7 cells after stimulation with 17β-estradiol, generated using ChIP-Chip (chromatin immunoprecipitation and tiling microarrays spanning the entire nonrepetitive human genome) (26). UP and DOWN poor-outcome signature genes with at least one MYC binding site within ± 5 kb of their transcription start site (orange) versus the same for all other genes on the tiling array (green).
Fig. 3.
MDA-MB-231 primary tumorigenesis and metastasis in vivo with stable MYC knockdown. (A) Western blot for MYC protein after stable, lentiviral-mediated knockdown with two different MYC hairpins (HP1 and HP2) compared with pLKO empty vector control after serial passage in MDA-MB-231 cells. (B) Proliferation curves for empty vector control (pLKO), HP1, and HP2 cells after serial passage over 4 days, showing absorbance as a measure of cell number (n = 3, 95% CI). (C) Tumor growth of control (pLKO) and HP1 cell xenografts in NOD/SCID mice (pLKO, n = 9; HP1, n = 7; 95% CI). (D) Boxplot of the number of lung metastases per mouse in control and MYC HP1 knockdown tumor-bearing mice (pLKO, n = 9; MYC HP1, n = 7; P value calculated from the two-sided, two-sample Wilcoxon test). (E) Representative immunohistochemistry for MYC protein expression in primary and metastatic tumor sections from the outlier animal in the MYC HP1 knockdown group. (F) Representative light microscopy (H&E) and immunohistochemistry (MKI67, TUNEL, vimentin, and e-cadherin) in pLKO control and MYC HP1 knockdown primary tumors. (Scale bars: 20 μm.)
Fig. 4.
MDA-MB-231 invasion and migration in vitro with stable MYC knockdown. (A) Representative light microscopy images of control (pLKO) and MYC knockdown (MYC HP1) MDA-MB-231 breast cancer cells migrating through Matrigel-filled microcapillaries. (B) Position of individual pLKO and MYC HP1 cells invading through Matrigel-filled microcapillaries over 24 h plotted against time. (C) Bar plot representing the average invasion speed through Matrigel for pLKO and MYC HP1 cells, 13.9 ± 1.1 μm/h for pLKO (n = 33) and 9.1 ± 0.9 μm/h for MYC HP1 (n = 31) and 10.9 ± 0.7 μm/h for MYC HP2 (n = 33). P values were computed by the two-sided Walsh t test. (D) Representative light microscopy images of pLKO and MYC HP1 MDA-MB-231 breast cancer cells migrating through collagen IV–coated microcapillaries. (E) Position of individual pLKO and MYC HP1 cells migrating along collagen IV–coated microcapillaries over 12 h plotted against time. (F) Bar plot representing the average migration speed through collagen-coated microcapillaries for pLKO and MYC HP1 knockdown cells, 82.5 ± 7.5 μm/h for pLKO (n = 17) and 70.4 ± 6.4 μm/h for MYC HP1 (n = 21). P values were computed by the two-sided Walsh t test. Also see
Movies S1
–
S4
.
Similar articles
- MYC and metastasis.
Wolfer A, Ramaswamy S. Wolfer A, et al. Cancer Res. 2011 Mar 15;71(6):2034-7. doi: 10.1158/0008-5472.CAN-10-3776. Cancer Res. 2011. PMID: 21406394 Free PMC article. Review. - MYC gene amplification is often acquired in lethal distant breast cancer metastases of unamplified primary tumors.
Singhi AD, Cimino-Mathews A, Jenkins RB, Lan F, Fink SR, Nassar H, Vang R, Fetting JH, Hicks J, Sukumar S, De Marzo AM, Argani P. Singhi AD, et al. Mod Pathol. 2012 Mar;25(3):378-87. doi: 10.1038/modpathol.2011.171. Epub 2011 Nov 4. Mod Pathol. 2012. PMID: 22056952 Free PMC article. - MYC Targets Scores Are Associated with Cancer Aggressiveness and Poor Survival in ER-Positive Primary and Metastatic Breast Cancer.
Schulze A, Oshi M, Endo I, Takabe K. Schulze A, et al. Int J Mol Sci. 2020 Oct 30;21(21):8127. doi: 10.3390/ijms21218127. Int J Mol Sci. 2020. PMID: 33143224 Free PMC article. - Feature genes in metastatic breast cancer identified by MetaDE and SVM classifier methods.
Tuo Y, An N, Zhang M. Tuo Y, et al. Mol Med Rep. 2018 Mar;17(3):4281-4290. doi: 10.3892/mmr.2018.8398. Epub 2018 Jan 9. Mol Med Rep. 2018. PMID: 29328377 Free PMC article. - Triterpene Acid (_3_-_O_-_p_-Coumaroyltormentic Acid) Isolated From Aronia Extracts Inhibits Breast Cancer Stem Cell Formation through Downregulation of c-Myc Protein.
Choi HS, Kim SL, Kim JH, Deng HY, Yun BS, Lee DS. Choi HS, et al. Int J Mol Sci. 2018 Aug 26;19(9):2528. doi: 10.3390/ijms19092528. Int J Mol Sci. 2018. PMID: 30149665 Free PMC article. Review.
Cited by
- A novel derivative of betulinic acid, SYK023, suppresses lung cancer growth and malignancy.
Hsu TI, Chen YJ, Hung CY, Wang YC, Lin SJ, Su WC, Lai MD, Kim SY, Wang Q, Qian K, Goto M, Zhao Y, Kashiwada Y, Lee KH, Chang WC, Hung JJ. Hsu TI, et al. Oncotarget. 2015 May 30;6(15):13671-87. doi: 10.18632/oncotarget.3701. Oncotarget. 2015. PMID: 25909174 Free PMC article. - The roles of long noncoding RNAs in breast cancer metastasis.
Liu L, Zhang Y, Lu J. Liu L, et al. Cell Death Dis. 2020 Sep 14;11(9):749. doi: 10.1038/s41419-020-02954-4. Cell Death Dis. 2020. PMID: 32929060 Free PMC article. Review. - CIP2A is a predictor of survival and a novel therapeutic target in bladder urothelial cell carcinoma.
Xue Y, Wu G, Wang X, Zou X, Zhang G, Xiao R, Yuan Y, Long D, Yang J, Wu Y, Xu H, Liu F, Liu M. Xue Y, et al. Med Oncol. 2013 Mar;30(1):406. doi: 10.1007/s12032-012-0406-6. Epub 2012 Dec 30. Med Oncol. 2013. PMID: 23275123 - Primary and Metastatic Pancreatic Cancer Cells Exhibit Differential Migratory Potentials.
Park JK, Hank T, Scherber CM, Lillemoe KD, Fernández-Del Castillo C, Warshaw AL, Toner M, Irimia D, Thayer SP, Liss AS. Park JK, et al. Pancreas. 2020 Jan;49(1):128-134. doi: 10.1097/MPA.0000000000001459. Pancreas. 2020. PMID: 31856088 Free PMC article.
References
- Carter SL, Eklund AC, Kohane IS, Harris LN, Szallasi Z. A signature of chromosomal instability inferred from gene expression profiles predicts clinical outcome in multiple human cancers. Nat Genet. 2006;38:1043–1048. - PubMed
- Liu R, et al. The prognostic role of a gene signature from tumorigenic breast-cancer cells. N Engl J Med. 2007;356:217–226. - PubMed
Publication types
MeSH terms
Substances
Grants and funding
- P50 CA089393/CA/NCI NIH HHS/United States
- R21 CA135601/CA/NCI NIH HHS/United States
- P50 CA89393/CA/NCI NIH HHS/United States
- K08 CA100339/CA/NCI NIH HHS/United States
- P41 EB002503/EB/NIBIB NIH HHS/United States
LinkOut - more resources
Full Text Sources
Other Literature Sources
Medical
Molecular Biology Databases


