Deletion of the huntingtin polyglutamine stretch enhances neuronal autophagy and longevity in mice - PubMed (original) (raw)
Deletion of the huntingtin polyglutamine stretch enhances neuronal autophagy and longevity in mice
Shuqiu Zheng et al. PLoS Genet. 2010.
Abstract
Expansion of a stretch of polyglutamine in huntingtin (htt), the protein product of the IT15 gene, causes Huntington's disease (HD). Previous investigations into the role of the polyglutamine stretch (polyQ) in htt function have suggested that its length may modulate a normal htt function involved in regulating energy homeostasis. Here we show that expression of full-length htt lacking its polyglutamine stretch (DeltaQ-htt) in a knockin mouse model for HD (Hdh(140Q/DeltaQ)), reduces significantly neuropil mutant htt aggregates, ameliorates motor/behavioral deficits, and extends lifespan in comparison to the HD model mice (Hdh(140Q/+)). The rescue of HD model phenotypes is accompanied by the normalization of lipofuscin levels in the brain and an increase in the steady-state levels of the mammalian autophagy marker microtubule-associate protein 1 light chain 3-II (LC3-II). We also find that DeltaQ-htt expression in vitro increases autophagosome synthesis and stimulates the Atg5-dependent clearance of truncated N-terminal htt aggregates. DeltaQ-htt's effect on autophagy most likely represents a gain-of-function, as overexpression of full-length wild-type htt in vitro does not increase autophagosome synthesis. Moreover, Hdh(DeltaQ/DeltaQ) mice live significantly longer than wild-type mice, suggesting that autophagy upregulation may be beneficial both in diseases caused by toxic intracellular aggregate-prone proteins and also as a lifespan extender in normal mammals.
Conflict of interest statement
The authors have declared that no competing interests exist.
Figures
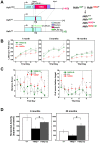
Figure 1. ΔQ-htt expression ameliorates motor and behavioral deficits in Hdh140Q/ΔQ mice.
(A) Diagram of the Hdh140Q, wild-type (Hdh7Q), and HdhΔQ exon 1, and a schematic of the breeding scheme used to generate the mice employed in this study. The expansion of the polyQ stretch in the Hdh140Q allele also includes human exon 1 sequences (purple) between a conserved _Xmn_I restriction site within exon 1 and a _Kpn_I restriction site located within intron 1, while the deletion of the polyQ stretch in the HdhΔQ allele also includes the insertion of a FLAG epitope tag (green) following the initiation codon. Endogenous mouse sequence is shown in light blue. (B) Accelerated rotarod testing of wild-type (+/+), Hdh140Q/+ (140Q/+), and Hdh140Q/ΔQ (140Q/ΔQ) mice (n = 6 for each genotype). Hdh140Q/+ versus +/+ at 5 months, ANOVA for genotype; P<0.03 and at 19 months; P<0.04. The performance of the Hdh140Q/ΔQ mice did not differ significantly from the wild-type controls. (C) Barnes maze testing of 5 month old wild-type (+/+), Hdh140Q/+, and Hdh140Q/ΔQ mice (n = 5 of each genotype). Hdh140Q/+ mice performed poorly on their distance scores compared to wild-type and Hdh140Q/ΔQ mice (ANOVA for genotype; F(2,4) = 5.96, P<0.02). Hdh140Q/ΔQ and wild type mice also made significantly fewer errors than Hdh140Q/+ mice before finding the target (ANOVA for genotype; F(2,4) = 25.28; P<0.001). *Significant differences on individual trial days between Hdh140Q/ΔQ and Hdh140Q/+ mice (Holm-Sidak post hoc analysis; P<0.001 to 0.05). (D) Horizontal activity in a novel environment was assessed in wild-type, Hdh140Q/+, and Hdh140Q/ΔQ mice (n = 5 of each genotype) at 6 and 20 months of age. At both ages, the Hdh140Q/+ mice were significantly more hypoactive than the Hdh140Q/ΔQ and wild- type mice (one way ANOVA F(2,12) = 6.63, P<0.02 and Bonferroni post-hoc analysis, P<0.02 at 6 months; one-way ANOVA (F(2,14) = 6.78, P<0.02 and Bonferroni post-hoc analysis Hdh140Q/ΔQ versus Hdh140Q/+ at 20 months, P<0.01).
Figure 2. HdhΔQ expression enhances longevity in a knockin mouse model for HD.
Kaplan-Meier survival curves are shown for Hdh140Q/+, Hdh140Q/140Q, and Hdh140Q/ΔQ mice (n = 8 mice of each genotype). The Hdh140Q/ΔQ mice lived significantly longer than either the Hdh140Q/140Q mice or the Hdh140Q/+ mice (log-rank test; χ2 = 9.9, P<0.003 and χ2 = 11.7, P<0.002, respectively). The lifespans of the Hdh140Q/+ and Hdh140Q/140Q mice did not differ significantly (χ2 = 0.03, P = 0.958).
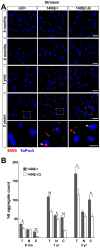
Figure 3. Reduced htt neuropil aggregates in the Hdh140Q/ΔQ striatum.
(A) Representative confocal images of the striatum from HdhΔQ/+, Hdh140Q/+, and Hdh140Q/ΔQ mice at 4 months, 6 months, 1 year, and 2 years of age that were immunostained with an antibody recognizing htt aggregates (MW8, red signal). Nuclei were stained with To-Pro-3 (blue). Enlarged images of the areas enclosed by dashed white boxes are shown in the bottom panels. Open and solid white arrowheads indicate neuropil and nuclear aggregates, respectively. Scale bars = 25 µm (top panels), 10 µm (bottom three panels). (B) Total; T, nuclear; N, and neuropil; C, htt aggregate numbers from the Hdh140Q/+ and Hdh140Q/ΔQ striatum (n = 4 mice of each genotype). The aggregate numbers (mean ± s.e.m.) represent counts/field from 8 images of the ventral and lateral striatum from each mouse. *P<0.05, **P<0.001.
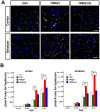
Figure 4. ΔQ-htt expression in Hdh140Q/ΔQ mice normalizes the increased lipofuscin accumulation that is observed in the Hdh140Q/+ brain.
(A) Confocal images of the parietal cortex and striatum from one year old HdhΔQ/+, Hdh140Q/+, and Hdh140Q/ΔQ mice (n = 4 of each genotype). Lipofuscin deposits are yellow (white arrowheads), and nuclei are stained with To-Pro-3 (blue). Scale bar = 25 µm. (B) Lipofuscin deposits at 4 months, 6 months, 1 year, and 2 years of age in wild-type (+/+), HdhΔQ/+, Hdh140Q/+, and Hdh140Q/ΔQ parietal cortex and striatum were quantified by measuring their pixel area/field (mean ± s.e.m.). *P<0.05, **P<0.001.
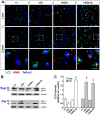
Figure 5. ΔQ-htt expression in mice enhances LC3 immunostaining and LC3-II steady-state levels.
(A) Confocal images of LC3 (green) and htt aggregate (MW8, red) immunostaining in the striatum from 1 year and 2 year old wild-type (+/+), HdhΔQ/+, Hdh140Q/+, and Hdh140Q/ΔQ mice (n = 4 of each genotype). Nuclei were stained with To-Pro-3 (blue). Enlarged images of the areas enclosed by dashed white boxes are shown in the bottom panels. White arrowheads indicate examples of htt aggregates co-immunostaining with LC3 (yellow signal). Scale bars = 25 µm (top panels), 10 µm (bottom panels). (B) Western analyses for LC3-I and LC3-II in striatal supernatant (Sup) and pellet (Pel) factions from 2 year old wild-type (+/+), HdhΔQ/+, Hdh140Q/+, and Hdh140Q/ΔQ mice (n = 4 of each genotype). Blots were stripped and re-probed with an antibody against β-actin to control for protein loading. The positions of protein standards (in kD) are indicated on the left. (C) Quantification of LC3-II levels in the supernatant and pellet fractions relative to actin. *P<0.004 versus +/+.
Figure 6. ΔQ-htt expression increases autophagosome synthesis and Atg5-dependent reduction of EGFP-74Q truncated htt aggregates in vitro.
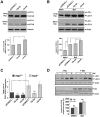
(A) SK-N-SH cells were transfected with control vector (pCDNA3.1), 7Q-htt, or ΔQ-htt constructs (transfections performed in triplicate at least twice), and cell lysates were analyzed for LC3-II levels 24 hr post-transfection by western blotting with an anti-LC3 antibody (for comparison, both longer and shorter exposures are shown), and densitometric analysis relative to actin levels. ΔQ-htt versus control; (***P<0.001), ΔQ-htt versus 7Q-htt; (P<0.002). (B) SK-N-SH cells were transfected with control vector, 7Q-htt, or ΔQ-htt constructs and treated with either DMSO (pCDNA3.1 transfected cells) or with 400 nM bafilomycin A1 (Baf) in DMSO (pCDNA3.1, 7Q-htt, or ΔQ-htt transfected cells) for 4 hours at 20 hr post-transfection. Autophagosome synthesis was analyzed by western blotting using an anti-LC3 antibody and densitometric analysis relative to actin. ***P<0.0001, **P<0.004. (C) Atg5+/+ (autophagy-competent) and Atg5−/− (autophagy-deficient) mouse embryonic fibroblasts were transfected with an EGFP-HDQ74 construct together with vector control, 7Q-htt, or ΔQ-htt constructs, and then assessed for the proportion of EGFP-positive cells with EGFP-74Q-htt aggregates by calculating the odds ratio 48 h post-transfection. ***P<0.0001 for both ΔQ-htt versus control, and for 7Q-htt versus control in Atg5+/+ cells, P<0.0001 for 7Q-htt versus control in Atg5−/− cells. ΔQ-htt's ability to reduce aggregates is abolished in Atg5−/− cells (P = 0.36 in comparison with control vector transfected cells). (D) Hdhex4/5/ex4/5 knock-out (Hdh−/−) mouse embryonic stem (ES) cells were transfected with EGFP along with either pCI (empty vector) or full-length wild-type huntingtin (1∶5 ratio) for 4 h, and then treated with DMSO (– Baf ) or 400 nM bafilomycin A1 in DMSO (+ Baf) for the last 2 h of the 48 h post-transfection period. Cells were then FACS-sorted for the EGFP-positive cells, in which LC3-II levels were assessed by western blotting and densitometric analysis relative to actin. Htt levels were assessed by western blotting using MAB2166. There were no significant changes in LC3-II levels in the huntingtin transfected Hdh−/− ES cells compared to empty vector transfected Hdh−/− ES cells in the absence (P = 0.7103) or presence (P = 0.4063) of bafilomycin A1.
Figure 7. ΔQ-htt expression stimulates autophagy through an mTOR–independent mechanism.
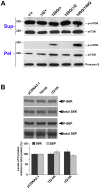
(A) Western blot analysis of the supernatant (Sup) and pellet (Pel) fractions from the striatum of 2 year old wild-type (+/+), HdhΔQ/+, Hdh140Q/+, Hdh140Q/ΔQ, and Hdh140Q/140Q mice probed with an antibody against phospho-mTOR (p-mTOR). The blots were stripped and re-probed with an antibody (mTOR) recognizing both phosphorylated (enzymatically active form) and non-phosphorylated mTOR (enzymatically inactive form correlating with the induction of autophagy). For protein loading control, a strip from the blot was stained with Ponceau S. The size of standards (in kD) is indicated on the left. (B) SK-N-SH cells transfected with vector control (pCDNA3.1), 7Q-htt, or ΔQ-htt constructs (transfections were performed in triplicate at least twice) were analyzed for mTOR activity 24 h post-transfection by western blotting using antibodies specific for two targets of mTOR kinase activity: S6 kinase (S6K) and S6 ribosomal protein (S6P). The relative levels of phospho-S6K (P-S6K) and phospho-S6P (P-S6P) to total S6K and S6P, respectively, were determined by densitometric scanning of western blots probed with antibodies specific for phospho- and total S6K or S6P. ΔQ-htt expression had no significant effect on the level of P-S6K (7Q-htt versus vector control, P = 0.96; ΔQ-htt versus vector control, P = 0.30) or P-S6P (7Q-htt versus vector control, P = 0.26; ΔQ-htt versus vector control, P = 0.47).
Figure 8. HdhΔQ/ΔQ mice live significantly longer than wild-type mice.
Kaplan-Meier survival curves are shown for wild-type (+/+, n = 15; 1 male and 14 females) and HdhΔQ/ΔQ (n = 15; 2 males and 13 females) mice. A significant extension of lifespan was observed in the HdhΔQ/ΔQ mice in comparison to the wild-type mice (χ2 = 9.6, P<0.005; Mantel-Cox log-rank test).
Similar articles
- The regulation of autophagosome dynamics by huntingtin and HAP1 is disrupted by expression of mutant huntingtin, leading to defective cargo degradation.
Wong YC, Holzbaur EL. Wong YC, et al. J Neurosci. 2014 Jan 22;34(4):1293-305. doi: 10.1523/JNEUROSCI.1870-13.2014. J Neurosci. 2014. PMID: 24453320 Free PMC article. - Huntington's Disease.
Finkbeiner S. Finkbeiner S. Cold Spring Harb Perspect Biol. 2011 Jun 1;3(6):a007476. doi: 10.1101/cshperspect.a007476. Cold Spring Harb Perspect Biol. 2011. PMID: 21441583 Free PMC article. Review. - [Huntington's disease: intracellular signaling pathways and neuronal death].
Humbert S, Saudou F. Humbert S, et al. J Soc Biol. 2005;199(3):247-51. doi: 10.1051/jbio:2005026. J Soc Biol. 2005. PMID: 16471265 Review. French.
Cited by
- N17 Modifies mutant Huntingtin nuclear pathogenesis and severity of disease in HD BAC transgenic mice.
Gu X, Cantle JP, Greiner ER, Lee CY, Barth AM, Gao F, Park CS, Zhang Z, Sandoval-Miller S, Zhang RL, Diamond M, Mody I, Coppola G, Yang XW. Gu X, et al. Neuron. 2015 Feb 18;85(4):726-41. doi: 10.1016/j.neuron.2015.01.008. Epub 2015 Feb 5. Neuron. 2015. PMID: 25661181 Free PMC article. - The Autophagy Lysosomal Pathway and Neurodegeneration.
Finkbeiner S. Finkbeiner S. Cold Spring Harb Perspect Biol. 2020 Mar 2;12(3):a033993. doi: 10.1101/cshperspect.a033993. Cold Spring Harb Perspect Biol. 2020. PMID: 30936119 Free PMC article. Review. - IRS2 increases mitochondrial dysfunction and oxidative stress in a mouse model of Huntington disease.
Sadagurski M, Cheng Z, Rozzo A, Palazzolo I, Kelley GR, Dong X, Krainc D, White MF. Sadagurski M, et al. J Clin Invest. 2011 Oct;121(10):4070-81. doi: 10.1172/JCI46305. Epub 2011 Sep 19. J Clin Invest. 2011. PMID: 21926467 Free PMC article. - Exploring the Role of Autophagy Dysfunction in Neurodegenerative Disorders.
Rana T, Behl T, Sehgal A, Mehta V, Singh S, Bhatia S, Al-Harrasi A, Bungau S. Rana T, et al. Mol Neurobiol. 2021 Oct;58(10):4886-4905. doi: 10.1007/s12035-021-02472-0. Epub 2021 Jul 2. Mol Neurobiol. 2021. PMID: 34212304 Review. - Autophagy and neurodegeneration.
Frake RA, Ricketts T, Menzies FM, Rubinsztein DC. Frake RA, et al. J Clin Invest. 2015 Jan;125(1):65-74. doi: 10.1172/JCI73944. Epub 2015 Jan 2. J Clin Invest. 2015. PMID: 25654552 Free PMC article. Review.
References
- Atwal RS, Xia J, Pinchev D, Taylor J, Epand RM, et al. Huntingtin has a membrane association signal that can modulate huntingtin aggregation, nuclear entry and toxicity. Hum Mol Genet. 2007;16:2600–2615. - PubMed
- Faber PW, Barnes GT, Srinidhi J, Chen J, Gusella JF, et al. Huntingtin interacts with a family of WW domain proteins. Hum Mol Genet. 1998;7:1463–1474. - PubMed
- Gao YG, Yan XZ, Song AX, Chang YG, Gao XC, et al. Structural Insights into the specific binding of huntingtin proline-rich region with the SH3 and WW domains. Structure. 2006;14:1755–1765. - PubMed
- Liu YF, Deth RC, Devys D. SH3 domain-dependent association of huntingtin with epidermal growth factor receptor signaling complexes. J Biol Chem. 1997;272:8121–8124. - PubMed
- The Huntington's Disease Collaborative Research Group. A novel gene containing a trinucleotide repeat that is expanded and unstable on Huntington's disease chromosomes. Cell. 1993;72:971–983. - PubMed
Publication types
MeSH terms
Substances
Grants and funding
- R56 NS043466/NS/NINDS NIH HHS/United States
- 064354/WT_/Wellcome Trust/United Kingdom
- WT_/Wellcome Trust/United Kingdom
- G0600194(77639)/MRC_/Medical Research Council/United Kingdom
- R01 NS043466/NS/NINDS NIH HHS/United States
- G0600194/MRC_/Medical Research Council/United Kingdom
- NS43466/NS/NINDS NIH HHS/United States
LinkOut - more resources
Full Text Sources
Molecular Biology Databases
Research Materials
Miscellaneous
