DAPK1 interaction with NMDA receptor NR2B subunits mediates brain damage in stroke - PubMed (original) (raw)
. 2010 Jan 22;140(2):222-34.
doi: 10.1016/j.cell.2009.12.055.
Xin Xu, Lisheng Peng, Xiaofen Zhong, Wenfeng Zhang, Mangala M Soundarapandian, Cherine Balel, Manqi Wang, Nali Jia, Wen Zhang, Frank Lew, Sic Lung Chan, Yanfang Chen, Youming Lu
Affiliations
- PMID: 20141836
- PMCID: PMC2820131
- DOI: 10.1016/j.cell.2009.12.055
DAPK1 interaction with NMDA receptor NR2B subunits mediates brain damage in stroke
Weihong Tu et al. Cell. 2010.
Abstract
N-methyl-D-aspartate (NMDA) receptors constitute a major subtype of glutamate receptors at extrasynaptic sites that link multiple intracellular catabolic processes responsible for irreversible neuronal death. Here, we report that cerebral ischemia recruits death-associated protein kinase 1 (DAPK1) into the NMDA receptor NR2B protein complex in the cortex of adult mice. DAPK1 directly binds with the NMDA receptor NR2B C-terminal tail consisting of amino acid 1292-1304 (NR2B(CT)). A constitutively active DAPK1 phosphorylates NR2B subunit at Ser-1303 and in turn enhances the NR1/NR2B receptor channel conductance. Genetic deletion of DAPK1 or administration of NR2B(CT) that uncouples an activated DAPK1 from an NMDA receptor NR2B subunit in vivo in mice blocks injurious Ca(2+) influx through NMDA receptor channels at extrasynaptic sites and protects neurons against cerebral ischemic insults. Thus, DAPK1 physically and functionally interacts with the NMDA receptor NR2B subunit at extrasynaptic sites and this interaction acts as a central mediator for stroke damage.
Copyright 2010 Elsevier Inc. All rights reserved.
Figures
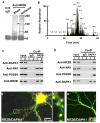
Figure 1. Ischemia Recruits DAPK1 into NMDA Receptor Complex
(A) The immune-precipitates with nonspecific IgG (N.S. IgG), or antibody against NMDA receptor NR2B subunit (anti-NR2B) in the membrane extracts (5 mg proteins) from the cortex of mice 2 hr after operation for sham or MCAO (Ischemia) were stained with Coomassie blue. (B) Base peak chromatogram from trypsin-digested products of a selected protein band (arrow head in [A]). (C and D) The membrane extracts (1 mg proteins) from the cortex of mice 2 hr after sham (lane 1) or MCAO (lane 2) were precipitated with nonspecific IgG (IgG) or anti-NR2B (C) or anti-DAPK1 (D) and probed with anti-DAPK1, anti-NR1, anti-PSD95 or anti-NR2B. Input: 20 μg of protein was loaded in each lane except the PSD95 lane, in which 10 μg proteins were loaded. (E–G) DAPK1+/+ (E) and DAPK1−/− (G) cultured neurons were stained with anti-DAPK1 (red) and anti-NR2B (green). A high magnified image (F) from a selected area in (E). In panels A–G, similar results were observed in each of the four experiments. See also Figure S1.
Figure 2. DAPK1 Directly Binds to NMDA Receptor NR2B Subunit
(A) Representation illustrates a series of GST fusion proteins with the NR2B C-terminal mutants. (B) Affinity binding assay shows that flag-tagged catalytic domain of DAPK1 binds with GST-NR2B839–1482 (~100 kDa) and GST-NR2B1292–1304 (~30 kDa). The blots show anti-Flag (top) and anti-GST (bottom). (C) NR2BCT suppresses DAPK1 association with NMDA receptor NR2B subunit. Membrane extracts (500 μg proteins) from the forebrain of mice 2 hr after MCAO were incubated with GST or the GST-NR2BCT839–1482 in the presence of 50 μM NR2BCT or sNR2BCT and probed with anti-DAPK1. (D) NR2BCT blocks NMDA receptor association with DAPK1 but not with PSD-95. Membrane extracts were precipitated with nonspecific IgG (IgG) or anti-NR2B in the presence of 50 μM NR2BCT or sNR2BCT and probed with anti-DAPK1, or anti-PSD-95, or anti-CaMK-IIα. Input: 50 μg of protein was loaded in each lane. In (B)–(D), similar results were observed in each of the four experiments.
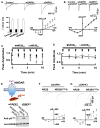
Figure 3. DAPK1 Phosphorylates NR2B at Ser-1303 and Increase the Channel Conductance
(A) Whole-cell currents at holding potential of −30 mV in HEK293 cells coexpressing NR1/NR2B receptors without (control) or with wild-type DAPK1 (wDAPK1) or constitutively active DAPK1 (cDAPK1). Bar graph shows decay time constants of the receptor currents fitted with two exponential components with τfast (75%, filled bars) and τslow (25%, open bars). The peak currents were plotted against holding potentials without (open circles) or with expression of wDAPK1 (triangles, n = 21 cells) or cDAPK1 (filled circles, n = 22 cells). (B) Expression of cDAPK1 does not alter NR2A receptor currents. Whole-cell currents are at a holding potential of −60 mV in HEK293 cells coexpressing the NR1/NR2A receptors without (control) or with wDAPK1 or cDAPK1. The peak currents were plotted against holding potentials without (open circles, n = 18 cells) or with expression of wDAPK1 (filled circles, n = 18 cells) or cDAPK1 (triangles, n = 18 cells). (C and D) NR2BCT antagonizes the cDAPK1-NR2B interaction. The averaged whole-cell currents are plotted against time with the intracellular perfusion of 10 (filled circles), 25 (open triangles) or 50 μM NR2BCT (open circles) or 50 μM sNR2BCT (filled triangles) in HEK293 cells coexpressing NR1/NR2B with cDAPK1 (C). In recordings from HEK293 cells coexpressing NR1/NR2B with wDAPK1 (D), 50 μM NR2BCT (open circles) or sNR2BCT (filled circles) were applied. The peak currents were normalized to baseline (defined as 1.0, n = 22 cell per group, *p < 0.01). Horizontal above the graphs indicate the period of peptide administration. Arrows indicate the time of application of 1 ms pulse of 500 μM glutamate. (E) Illustration (top) shows that DAPK1 targets to NR2B C-terminal at Ser-1303. Bottom: the NR1/NR2B (lane: NR2B) or the mutant NR1/NR2BS1303A (lane: NR2BS1303A) that were coexpressed with wDAPK1 or cDAPK1 in HEK293 cells were subjected to western blot with anti-_p_S1303 or anti-NR2B. Similar results were observed in each of four experiments. (F and G) Whole-cell currents are recorded at holding potential of −30 mV in HEK293 cells coexpressing NR1/NR2B or the mutant NR1/NR2BS1303A receptors with wDAPK1(F) or cDAPK1 (G). The peak currents were plotted against holding potentials in HEK293 cells with expression of NR1/NR2B (filled circles, n = 23 cells) or the mutant NR1/NR2BS1303A (open circles, n = 21 cells). In panels A–G, data are mean ± SEM, *p < 0.01.
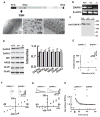
Figure 4. The Mutant Mice Lacking the DAPK1 Gene Have Normal Synaptic Transmission
(A) A promoterless gene trapping vector fused into a reporter gene (β-geo) was inserted into the first intron of DAPK1. Staining on a sagittal brain section from an adult DAPK1−/− mouse shows the β-geo protein in the cortex and hippocampus. (B and C) Representatives show the RT-PCR and western blots of DAPK1 mRNA (B) and proteins (C) in the brain of the homozygous (DAPK1−/−), heterozygous (DAPK1−/+) and their wild-type littermates (DAPK1+/+) mice. (D) Blots show DAPK2, DAPK3, and synaptic proteins in the brains of DAPK1+/+, DAPK1+/−, and DAPK1−/− mice. The intensities of the blots (bar graph) were normalized to the respective blots in DAPK1+/+ mice (defined as 1.0). Data are mean ± SEM (n = 4 mice/group). (E) The DAPK1−/− mice have normal input-output responses. The EPSCs (top) were recorded from CA1 pyramidal neurons at holding potential of −70 mV. The mean amplitudes from DAPK1+/+ (open circles) and DAPK1−/− (filled circles) mice, as summarized in graph (bottom), were plotted against the intensities of stimulus. Data are mean ± SEM (n = 8 cells/4 mice per group). (F and H) Sweeps (top) and the current-voltage relations of the excitatory post-synaptic currents (EPSCs) mediated by AMPA (EPSCsAMPA, F) and the NMDA receptors (EPSCsNMDA, G) at holding potentials of −80, −40, 0 +20, or +40 mV were recorded in CA1 neurons from DAPK1+/+ (open circles) and DAPK1−/− (filled circles) mice. Data are mean ± SEM (n = 12 cells/6 mice per group). (H) A plot represents the normalized peak amplitude of the EPSCsAMPA in CA1 neurons from DAPK1+/+ (open circles) and DAPK1−/− mice (filled circles). The traces above the graph are averages of three sweeps taken at the time points indicated by the letter above the x axis. Arrow indicates the time of tetanus. Data are mean ± SEM (n = 12 cell/6 mice per group).
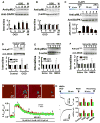
Figure 5. Activation of DAPK1 Induces Ca2+ Influx through Extrasynaptic NMDA Receptors
(A and B) DAPK1+/+ (A) and DAPK1−/− (B) cortical neurons were exposed to OGD for 0, 5, 15, or 30 min. Immediately after OGD (OGD) or 30 min after OGD washout (w), DAPK1 complex was precipitated and blotted with anti-_p_MLC or anti-DAPK1. The intensities of the anti-_p_MLC (filled bars) and anti-DAPK1 (open bars) blots were normalized to their respective signals at 0 min OGD (defined as 1.0, n = 16). (C) DAPK1+/+ neurons were treated with saline (lane 1 and lane 2), 10 μM CNQX (lane 3), 50 μM D-AP5 (lane 4), or Ca2+-free (lane 5) for 10 min, and then challenged with sham control (lane 1) or with OGD (lane 2 through lane 5) for 30 min. DAPK1 complex was then precipitated and blotted with anti-_p_MLC or anti-DAPK1. The ratio of anti-_p_MLC versus anti-DAPK1 blots were calculated (n = 12 cultures/4 mice) and summarized in bar graph. (D) DAPK1+/+ (lane 1) and DAPK1−/− (lane 2) neurons were exposed to shame or OGD for 30 min. NMDA receptor complex was precipitated with anti-NR1 and blotted with anti-_p_S1303 or anti-NR2B. The intensities of blots were normalized to their respective controls (defined as 1.0, n = 12 cultures/4 mice). (E and F) NMDA treatment activates DAPK1 (E) and increases the levels of _p_S1303 in cortical neurons (F). DAPK1+/+ (lane 1) and DAPK1−/− (lane 2) cortical neurons were challenged with saline, 10 μM bicuculline (Bic), or 50 μM NMDA/10 μM glycine for 30 min. Endogenous DAPK1 and NMDA receptor protein complexes were then precipitated and blotted, as indicated. The intensities of the blots were normalized to their respective controls (defined as 1.0), and summarized in bar graphs (n = 12 cultures/4 mice). (G) Images are taken at the time points indicated by the numbers above the traces from single DAPK1+/+ neuron with pre-OGD (Red) or sham (Green). Ca2+ transients were evoked by 30 μM Bic and 10 μM nifedipine (Nif) and blocked by 10 μM MK-801. (H) Cortical neurons were exposed to control, OGD, 10 μM Bic, or 50 μM NMDA/10 μM glycine for 30 min. 30 min after washout Ca2+ transients and whole-cell currents (eNMDAc) were evoked by a 5-ms pulse of 100 μM NMDA/10 μM glycine. Data (*p < 0.01) in bar graphs are DAPK1+/+ (red bars) and DAPK1−/− (green bars) neurons (n = 22 cells per group). In panels A–H, data in bar graphs are mean ± SEM. See also Figure S2.
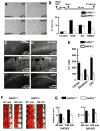
Figure 6. Genetic Deletion of DAPK1 Protects against Ischemic Neuronal Death
(A) DAPK1 deletion protects cortical neurons against OGD insult. DAPK1+/+ and DAPK1−/− cortical cells were challenged with OGD for 60 min. 24 hr after washout the cultures were stained with propidium iodide (PI, red), and single DIC or double DIC/PI images were collected. (B) Bar graph summarizes the percentage of PI+ cells (n = 12 cultures). Data are mean ± SEM. (C–E) Images of cortex, striatum and the hippocampus from DAPK1−/− (C) and DAPK1+/+ (D) mice that were stained with Fluoro-Jade 6 days after transient global ischemia. Bar graph (E) shows summarized Fluoro-Jade-labeled cells (n = 7). Data are mean ± SEM. (F and G) Images of the brain sections (1.0 mm, F) from DAPK1+/+ and DAPK1−/− mice 24 hr after operation for 60 min or 120 min MCAO that were stained with TTC. Bar graphs show the infarct volume and neurological scores (N.S.). Data are mean ± SEM (*p < 0.01).
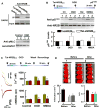
Figure 7. Inhibition of DAPK1-NMDA Receptor Interaction Protects against Stroke Damage
(A) Tat-NR2BCT treatment disturbs the DAPK1-NMDA receptor association without affecting DAPK1 activity. DAPK1+/+ cortical neurons were treated with 50 μM Tat-NR2BCT or Tat-sNR2BCT or saline for 30 min and exposed to OGD for 30 min. NMDA receptor complex was precipitated with anti-NR2B (top) or anti-DAPK1 (bottom) and blotted with anti-DAPK1 or anti-_p_MLC, as indicated. (B) DAPK1+/+ cortical neurons were treated with 50 μM Tat-sNR2BCT (lane 1) or Tat-NR2BCT (lane 2) for 30 min and were then exposed to control, OGD, 10 μM bicuculline (Bic), or 50 μM NMDA/10 μM glycine for 30 min. Anti-NR1 precipitates were blotted with anti-_p_S1303 or anti-NR2B, as indicated. Data in bar graph are mean ± SEM (n = 16 cultures/4 mice, *p < 0.01). (C) DAPK1+/+ cortical neurons were treated with 50 μM Tat-sNR2BCT (purple traces) or Tat-NR2BCT (green traces) for 30 min and were then exposed to control, OGD or 50 μM NMDA/10 μM glycine for 30 min. 30 min after washout and Ca2+ transients (top traces) whole-cell currents (bottom traces) were recorded. Data from Tat-NR2BCT (purple bars) and Tat-sNR2BCT (green bars) in bar graphs are mean ± SEM (n = 16 recordings per group, *p < 0.01). (D) The adult male DAPK1+/+ mice were received a single injection (10 mg/kg, i.v.) of Tat-NR2BCT (1) or Tat-sNR2BCT (2) 60 min before or 60 min after MCAO (After). The infarction volume and neurological scores (N.S.) were summarized in the bar graphs (G). Data are mean ± SEM (*p < 0.001). See also Figure S3.
Comment in
- Blocking the deadly effects of the NMDA receptor in stroke.
Martin HG, Wang YT. Martin HG, et al. Cell. 2010 Jan 22;140(2):174-6. doi: 10.1016/j.cell.2010.01.014. Cell. 2010. PMID: 20141829
Similar articles
- Blocking the deadly effects of the NMDA receptor in stroke.
Martin HG, Wang YT. Martin HG, et al. Cell. 2010 Jan 22;140(2):174-6. doi: 10.1016/j.cell.2010.01.014. Cell. 2010. PMID: 20141829 - Genetic Mutation of GluN2B Protects Brain Cells Against Stroke Damages.
Tang N, Wu J, Zhu H, Yan H, Guo Y, Cai Y, Yan H, Shi Y, Shu S, Pei L, Lu Y. Tang N, et al. Mol Neurobiol. 2018 Apr;55(4):2979-2990. doi: 10.1007/s12035-017-0562-y. Epub 2017 Apr 29. Mol Neurobiol. 2018. PMID: 28456939 - Exploring putative inhibitors of Death Associated Protein Kinase 1 (DAPK1) via targeting Gly-Glu-Leu (GEL) and Pro-Glu-Asn (PEN) substrate recognition motifs.
Singh P, Talwar P. Singh P, et al. J Mol Graph Model. 2017 Oct;77:153-167. doi: 10.1016/j.jmgm.2017.08.001. Epub 2017 Aug 18. J Mol Graph Model. 2017. PMID: 28858643 - Neuroprotective effect of estrogen: role of nonsynaptic NR2B-containing NMDA receptors.
Liu SB, Zhao MG. Liu SB, et al. Brain Res Bull. 2013 Apr;93:27-31. doi: 10.1016/j.brainresbull.2012.10.004. Epub 2012 Oct 17. Brain Res Bull. 2013. PMID: 23085545 Review. - Glutamate-based therapeutic approaches: NR2B receptor antagonists.
Gogas KR. Gogas KR. Curr Opin Pharmacol. 2006 Feb;6(1):68-74. doi: 10.1016/j.coph.2005.11.001. Epub 2005 Dec 22. Curr Opin Pharmacol. 2006. PMID: 16376149 Review.
Cited by
- The subtype of GluN2 C-terminal domain determines the response to excitotoxic insults.
Martel MA, Ryan TJ, Bell KF, Fowler JH, McMahon A, Al-Mubarak B, Komiyama NH, Horsburgh K, Kind PC, Grant SG, Wyllie DJ, Hardingham GE. Martel MA, et al. Neuron. 2012 May 10;74(3):543-56. doi: 10.1016/j.neuron.2012.03.021. Neuron. 2012. PMID: 22578505 Free PMC article. - Glutamate receptor ion channels: structure, regulation, and function.
Traynelis SF, Wollmuth LP, McBain CJ, Menniti FS, Vance KM, Ogden KK, Hansen KB, Yuan H, Myers SJ, Dingledine R. Traynelis SF, et al. Pharmacol Rev. 2010 Sep;62(3):405-96. doi: 10.1124/pr.109.002451. Pharmacol Rev. 2010. PMID: 20716669 Free PMC article. Review. - Calcium/Calmodulin-Dependent Kinase (CaMKII) Inhibition Protects Against Purkinje Cell Damage Following CA/CPR in Mice.
Chalmers NE, Yonchek J, Steklac KE, Ramsey M, Bayer KU, Herson PS, Quillinan N. Chalmers NE, et al. Mol Neurobiol. 2020 Jan;57(1):150-158. doi: 10.1007/s12035-019-01765-9. Epub 2019 Sep 13. Mol Neurobiol. 2020. PMID: 31520314 Free PMC article. - Beyond canonical PROTAC: biological targeted protein degradation (bioTPD).
Wang H, Zhou R, Xu F, Yang K, Zheng L, Zhao P, Shi G, Dai L, Xu C, Yu L, Li Z, Wang J, Wang J. Wang H, et al. Biomater Res. 2023 Jul 21;27(1):72. doi: 10.1186/s40824-023-00385-8. Biomater Res. 2023. PMID: 37480049 Free PMC article. Review. - Fashioning drugs for stroke.
Lai TW, Wang YT. Lai TW, et al. Nat Med. 2010 Dec;16(12):1376-8. doi: 10.1038/nm1210-1376. Nat Med. 2010. PMID: 21135846 No abstract available.
References
- Aarts M, Liu Y, Liu L, Besshoh S, Arundine M, Gurd JW, Wang YT, Salter MW, Tymianski M. Treatment of ischemic brain damage by perturbing NMDA receptor- PSD-95 protein interactions. Science. 2002;298:846–850. - PubMed
- Aarts M, Iihara K, Wei WL, Xiong ZG, Arundine M, Cerwinski W, Mac-Donald JF, Tymianski M. A key role for TRPM7 channels in anoxic neuronal death. Cell. 2003;115:863–877. - PubMed
- Bano D, Young KW, Guerin CJ, Lefeuvre R, Rothwell NJ, Naldini L, Rizzuto R, Carafoli E, Nicotera P. Cleavage of the plasma membrane Na+/Ca2+ exchanger in excitotoxicity. Cell. 2005;120:275–285. - PubMed
- Bialik S, Kimchi A. The Death-Associated Protein Kinases: Structure, Function, and Beyond. Annu Rev Biochem. 2006;75:189–200. - PubMed
Publication types
MeSH terms
Substances
Grants and funding
- R01 NS051383/NS/NINDS NIH HHS/United States
- R01 NS051383-06/NS/NINDS NIH HHS/United States
- R01NS5051383YL/NS/NINDS NIH HHS/United States
- R01 NS051383-01A2/NS/NINDS NIH HHS/United States
- R01 NS051383-03/NS/NINDS NIH HHS/United States
- R01 AG033282-03/AG/NIA NIH HHS/United States
- R01 NS051383-05/NS/NINDS NIH HHS/United States
- R01 AG033282-02/AG/NIA NIH HHS/United States
- R01 AG033282/AG/NIA NIH HHS/United States
- R01 NS051383-04/NS/NINDS NIH HHS/United States
- R01AG033282YL/AG/NIA NIH HHS/United States
- R01 NS051383-02/NS/NINDS NIH HHS/United States
- R01 AG033282-01A1/AG/NIA NIH HHS/United States
LinkOut - more resources
Full Text Sources
Other Literature Sources
Medical
Molecular Biology Databases
Miscellaneous
