T1r3 taste receptor involvement in gustatory neural responses to ethanol and oral ethanol preference - PubMed (original) (raw)
T1r3 taste receptor involvement in gustatory neural responses to ethanol and oral ethanol preference
Susan M Brasser et al. Physiol Genomics. 2010 May.
Abstract
Elevated alcohol consumption is associated with enhanced preference for sweet substances across species and may be mediated by oral alcohol-induced activation of neurobiological substrates for sweet taste. Here, we directly examined the contribution of the T1r3 receptor protein, important for sweet taste detection in mammals, to ethanol intake and preference and the neural processing of ethanol taste by measuring behavioral and central neurophysiological responses to oral alcohol in T1r3 receptor-deficient mice and their C57BL/6J background strain. T1r3 knockout and wild-type mice were tested in behavioral preference assays for long-term voluntary intake of a broad concentration range of ethanol, sucrose, and quinine. For neurophysiological experiments, separate groups of mice of each genotype were anesthetized, and taste responses to ethanol and stimuli of different taste qualities were electrophysiologically recorded from gustatory neurons in the nucleus of the solitary tract. Mice lacking the T1r3 receptor were behaviorally indifferent to alcohol (i.e., ∼50% preference values) at concentrations typically preferred by wild-type mice (5-15%). Central neural taste responses to ethanol in T1r3-deficient mice were significantly lower compared with C57BL/6J controls, a strain for which oral ethanol stimulation produced a concentration-dependent activation of sweet-responsive NTS gustatory neurons. An attenuated difference in ethanol preference between knockouts and controls at concentrations >15% indicated that other sensory and/or postingestive effects of ethanol compete with sweet taste input at high concentrations. As expected, T1r3 knockouts exhibited strongly suppressed behavioral and neural taste responses to sweeteners but did not differ from wild-type mice in responses to prototypic salt, acid, or bitter stimuli. These data implicate the T1r3 receptor in the sensory detection and transduction of ethanol taste.
Keywords: alcohol preference; knockout mice.
Figures
Fig. 1.
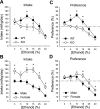
Voluntary intake (ml/kg/day) and percent preference for ethanol in a 2-bottle choice assay. A: mean ± SE ethanol intake as a function of concentration in T1r3 knockout (KO) and C57BL/6J wild-type (WT) mice; n = 12/genotype. B: mean ± SE ethanol intake by concentration in male and female mice; n = 12/sex. C: mean ± SE ethanol preference at each concentration in KO and WT mice; n = 12/genotype. D: mean ± SE ethanol preference by concentration in males and females; n = 12/sex. *Significant difference between KO and WT or male and female (P < 0.05).
Fig. 2.
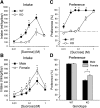
Voluntary intake (ml/kg/day) and percent preference for sucrose in a 2-bottle choice assay. A: mean ± SE sucrose intake as a function of concentration in T1r3 KO and C57BL/6J WT mice; n = 12/genotype. B: mean ± SE sucrose intake by concentration in male and female mice; n = 12/sex. C: mean ± SE sucrose preference at each concentration in KO and WT mice; n = 12/genotype. D: mean + SE sucrose preference in KO and WT males and females collapsed across concentration; n = 6/sex/genotype. *Significant difference between KO and WT or male and female (P < 0.05).
Fig. 3.
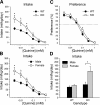
Voluntary intake (ml/kg/day) and percent preference for quinine in a 2-bottle choice assay. A: mean ± SE quinine intake as a function of concentration in T1r3 KO and C57BL/6J WT mice; n = 12/genotype. B: mean ± SE quinine intake by concentration in male and female mice; n = 12/sex. C: mean ± SE quinine preference at each concentration in KO and WT mice; n = 12/genotype. D: mean + SE quinine intake in KO and WT males and females collapsed across concentration. n = 6/sex/genotype. *Significant difference between KO and WT or male and female (P < 0.05).
Fig. 4.
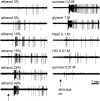
Digital oscilloscope records showing taste activity measured from a single nucleus of the solitary tract (NTS) neuron recorded from a C57BL/6J WT mouse. Taste-evoked trains of action potentials were elicited by oral application of various concentrations of ethanol and sweet (sucrose, glycine), salty (NaCl), acidic (HCl), and bitter (quinine) taste stimuli. ↑Stimulus onset.
Fig. 5.
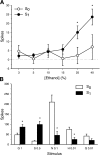
Responses to ethanol and taste stimuli in sucrose responsive (S1, n = 15) and sucrose nonresponsive (S0, n = 11) NTS neurons recorded from C57BL/6J WT mice. A: mean ± SE responses in S0 and S1 cells to an ascending concentration (%, vol/vol) series of ethanol. B: mean + SE responses in S0 and S1 cells to glycine (G), sucrose (S), NaCl (N), HCl (H), and quinine (Q). Concentration ([M]) follows abbreviation. *Significant difference between S0 and S1 (P < 0.05).
Fig. 6.
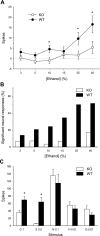
Responses to ethanol and taste stimuli in all NTS neurons (n = 28) sampled from T1r3 KO mice and all NTS neurons (n = 26) recorded from C57BL/6J WT mice. A: mean ± SE responses in KO and WT cells to an ascending concentration (%, vol/vol) series of ethanol. B: for each genotype, percentage of all sampled neural responses to each concentration of ethanol that were significantly elevated above baseline (prestimulus) activity. C: mean + SE responses in KO and WT cells to glycine (G), sucrose (S), NaCl (N), HCl (H), and quinine (Q). Concentration ([M]) follows abbreviation. *Significant difference between KO and WT (P < 0.05).
Fig. 7.
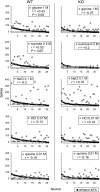
Across-neuron patterns of response to 40% ethanol and sweet (glycine, sucrose), salty (NaCl), acidic (HCl), and bitter (quinine) stimuli measured across NTS neurons (n = 26) recorded from C57BL/6J WT mice and NTS cells (n = 28) sampled from T1r3 KO mice. The Pearson coefficient of correlation (r) calculated between the response pattern to ethanol and each stimulus is given. P < 0.05 indicates that a correlation was significant.
Similar articles
- Contribution of the T1r3 taste receptor to the response properties of central gustatory neurons.
Lemon CH, Margolskee RF. Lemon CH, et al. J Neurophysiol. 2009 May;101(5):2459-71. doi: 10.1152/jn.90892.2008. Epub 2009 Mar 11. J Neurophysiol. 2009. PMID: 19279151 Free PMC article. - Strain differences in the neural, behavioral, and molecular correlates of sweet and salty taste in naive, ethanol- and sucrose-exposed P and NP rats.
Coleman J, Williams A, Phan TH, Mummalaneni S, Melone P, Ren Z, Zhou H, Mahavadi S, Murthy KS, Katsumata T, DeSimone JA, Lyall V. Coleman J, et al. J Neurophysiol. 2011 Nov;106(5):2606-21. doi: 10.1152/jn.00196.2010. Epub 2011 Aug 17. J Neurophysiol. 2011. PMID: 21849614 Free PMC article. - T1R3 taste receptor is critical for sucrose but not Polycose taste.
Zukerman S, Glendinning JI, Margolskee RF, Sclafani A. Zukerman S, et al. Am J Physiol Regul Integr Comp Physiol. 2009 Apr;296(4):R866-76. doi: 10.1152/ajpregu.90870.2008. Epub 2008 Dec 17. Am J Physiol Regul Integr Comp Physiol. 2009. PMID: 19091911 Free PMC article. - Oral, post-oral and genetic interactions in sweet appetite.
Sclafani A. Sclafani A. Physiol Behav. 2006 Nov 30;89(4):525-30. doi: 10.1016/j.physbeh.2006.03.021. Epub 2006 Apr 27. Physiol Behav. 2006. PMID: 16647093 Free PMC article. Review. - Chorda tympani responses in two inbred strains of mice with different taste preferences.
Frank ME, Blizard DA. Frank ME, et al. Physiol Behav. 1999 Aug;67(2):287-97. doi: 10.1016/s0031-9384(99)00071-2. Physiol Behav. 1999. PMID: 10477061 Review.
Cited by
- Chemosensory responsiveness to ethanol and its individual sensory components in alcohol-preferring, alcohol-nonpreferring and genetically heterogeneous rats.
Brasser SM, Silbaugh BC, Ketchum MJ, Olney JJ, Lemon CH. Brasser SM, et al. Addict Biol. 2012 Mar;17(2):423-36. doi: 10.1111/j.1369-1600.2011.00415.x. Epub 2011 Nov 29. Addict Biol. 2012. PMID: 22129513 Free PMC article. - Postnatal Exposure to Ethanol Increases Its Oral Acceptability to Adolescent Rats.
Tang J, Youngentob SL, Glendinning JI. Tang J, et al. Chem Senses. 2018 Sep 22;43(8):655-664. doi: 10.1093/chemse/bjy056. Chem Senses. 2018. PMID: 30169758 Free PMC article. - Sucrose-conditioned flavor preferences in sweet ageusic T1r3 and Calhm1 knockout mice.
Sclafani A, Marambaud P, Ackroff K. Sclafani A, et al. Physiol Behav. 2014 Mar 14;126:25-9. doi: 10.1016/j.physbeh.2013.12.003. Epub 2013 Dec 31. Physiol Behav. 2014. PMID: 24384370 Free PMC article. - Ventromedial prefrontal cortex response to concentrated sucrose reflects liking rather than sweet quality coding.
Rudenga KJ, Small DM. Rudenga KJ, et al. Chem Senses. 2013 Sep;38(7):585-94. doi: 10.1093/chemse/bjt029. Epub 2013 Jul 4. Chem Senses. 2013. PMID: 23828907 Free PMC article. - Nutrient-conditioned intake stimulation does not require a distinctive flavor cue in rats.
Sclafani A, Ackroff K. Sclafani A, et al. Appetite. 2020 Nov 1;154:104793. doi: 10.1016/j.appet.2020.104793. Epub 2020 Jul 1. Appetite. 2020. PMID: 32621941 Free PMC article.
References
- Belknap JK, Crabbe JC, Young ER. Voluntary consumption of ethanol in 15 inbred mouse strains. Psychopharmacology (Berl) 112: 503–510, 1993. - PubMed
Publication types
MeSH terms
Substances
LinkOut - more resources
Full Text Sources
Research Materials
