Membrane curvature controls dynamin polymerization - PubMed (original) (raw)
Membrane curvature controls dynamin polymerization
Aurélien Roux et al. Proc Natl Acad Sci U S A. 2010.
Abstract
The generation of membrane curvature in intracellular traffic involves many proteins that can curve lipid bilayers. Among these, dynamin-like proteins were shown to deform membranes into tubules, and thus far are the only proteins known to mechanically drive membrane fission. Because dynamin forms a helical coat circling a membrane tubule, its polymerization is thought to be responsible for this membrane deformation. Here we show that the force generated by dynamin polymerization, 18 pN, is sufficient to deform membranes yet can still be counteracted by high membrane tension. Importantly, we observe that at low dynamin concentration, polymer nucleation strongly depends on membrane curvature. This suggests that dynamin may be precisely recruited to membrane buds' necks because of their high curvature. To understand this curvature dependence, we developed a theory based on the competition between dynamin polymerization and membrane mechanical deformation. This curvature control of dynamin polymerization is predicted for a specific range of concentrations ( approximately 0.1-10 microM), which corresponds to our measurements. More generally, we expect that any protein that binds or self-assembles onto membranes in a curvature-coupled way should behave in a qualitatively similar manner, but with its own specific range of concentration.
Conflict of interest statement
The authors declare no conflict of interest.
Figures
Fig. 1.
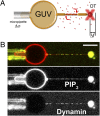
Experimental setup. (A) Schematic drawing of the experimental setup. A micropipette controls the GUV tension, Δσ, while optical tweezers are used to extract a membrane tube and measure the force needed to hold the tube (Δ_f_) as dynamin (red) polymerizes along it. The distribution of dynamin is simultaneously measured via confocal imaging. (B) Typical dual-color image of a GUV labeled with GloPIP2 (red channel) and dynamin labeled with Alexa 488 (green channel). Inhomogeneities in the red channel are due to bleedthrough from the green channel to the red. (Scale bar, 10 μm.)
Fig. 2.
Dynamin polymerization force measurements. (A) Sequence of confocal images following the injection of fluorescent dynamin (green; 12 μM) in the vicinity of a tube pulled from a GUV (time in seconds). (B) Plot of tube-holding force versus time after injection of dynamin (t = 0) shown for two vesicles with different membrane tensions. Dynamin rapidly reduces the tube-holding force from its initial value, fb, to a lower final level, fd (see text). (C) Plot of fd versus membrane tension showing a linear dependence (11 GUVs). (D) Images of a nucleation/growth process occurring for a dynamin concentration of 440 nM. Following a few stepwise increases of aspiration pressure (1), dots of dynamin appear on the tube (2). With the aspiration then held constant, the dynamin clusters continue to grow (2–4) until full coverage is reached (5). (E) Plot of force (smoothed average, red; raw data, gray) versus time for the experiment presented in D. The force starts to drop when dynamin fully covers the tube (5). (Scale bars, 10 μm.)
Fig. 3.
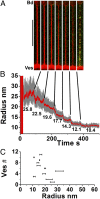
Curvature control of dynamin nucleation. Images of the membrane tube (A) (membrane, red; dynamin, green) following each stepwise reduction of tube radius (nm) as indicated in B. Polymerization of dynamin is only visible for the smallest tube radius. (Scale bar, 10 μm.) (C) Critical radius windows obtained from 11 vesicles.
Fig. 4.
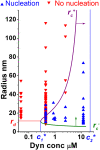
Phase diagram of dynamin nucleation as a function of tube radius and dynamin concentration. Experimental results are marked with triangles (red, inverted = no nucleation; blue, upright = nucleation). Boundaries of the region of dynamin nucleation, rc+ (purple line, arrow) and rc− (green line, arrow), were calculated for the theoretical model:  and
and  (
(
SI Mathematical Modeling
). Nucleation should not occur below the lower concentration, _c_1*. Above the higher concentration, _c_2*, nucleation should always occur, independent of membrane tube radius. rd corresponds to the internal radius of a dynamin-coated membrane tube.
Similar articles
- Deformation of dynamin helices damped by membrane friction.
Morlot S, Lenz M, Prost J, Joanny JF, Roux A. Morlot S, et al. Biophys J. 2010 Dec 1;99(11):3580-8. doi: 10.1016/j.bpj.2010.10.015. Biophys J. 2010. PMID: 21112282 Free PMC article. - Structure of a bacterial dynamin-like protein lipid tube provides a mechanism for assembly and membrane curving.
Low HH, Sachse C, Amos LA, Löwe J. Low HH, et al. Cell. 2009 Dec 24;139(7):1342-52. doi: 10.1016/j.cell.2009.11.003. Cell. 2009. PMID: 20064379 Free PMC article. - Membrane shape at the edge of the dynamin helix sets location and duration of the fission reaction.
Morlot S, Galli V, Klein M, Chiaruttini N, Manzi J, Humbert F, Dinis L, Lenz M, Cappello G, Roux A. Morlot S, et al. Cell. 2012 Oct 26;151(3):619-29. doi: 10.1016/j.cell.2012.09.017. Cell. 2012. PMID: 23101629 Free PMC article. - Dynamin: functional design of a membrane fission catalyst.
Schmid SL, Frolov VA. Schmid SL, et al. Annu Rev Cell Dev Biol. 2011;27:79-105. doi: 10.1146/annurev-cellbio-100109-104016. Epub 2011 May 18. Annu Rev Cell Dev Biol. 2011. PMID: 21599493 Review. - Mechanics of dynamin-mediated membrane fission.
Morlot S, Roux A. Morlot S, et al. Annu Rev Biophys. 2013;42:629-49. doi: 10.1146/annurev-biophys-050511-102247. Annu Rev Biophys. 2013. PMID: 23541160 Free PMC article. Review.
Cited by
- Gene Electrotransfer: A Mechanistic Perspective.
Rosazza C, Meglic SH, Zumbusch A, Rols MP, Miklavcic D. Rosazza C, et al. Curr Gene Ther. 2016;16(2):98-129. doi: 10.2174/1566523216666160331130040. Curr Gene Ther. 2016. PMID: 27029943 Free PMC article. Review. - Dual role of BAR domain-containing proteins in regulating vesicle release catalyzed by the GTPase, dynamin-2.
Neumann S, Schmid SL. Neumann S, et al. J Biol Chem. 2013 Aug 30;288(35):25119-25128. doi: 10.1074/jbc.M113.490474. Epub 2013 Jul 16. J Biol Chem. 2013. PMID: 23861397 Free PMC article. - Insights into Membrane Curvature Sensing and Membrane Remodeling by Intrinsically Disordered Proteins and Protein Regions.
Has C, Sivadas P, Das SL. Has C, et al. J Membr Biol. 2022 Jun;255(2-3):237-259. doi: 10.1007/s00232-022-00237-x. Epub 2022 Apr 22. J Membr Biol. 2022. PMID: 35451616 Free PMC article. Review. - Topography design in model membranes: Where biology meets physics.
Chand S, Beales P, Claeyssens F, Ciani B. Chand S, et al. Exp Biol Med (Maywood). 2019 Mar;244(4):294-303. doi: 10.1177/1535370218809369. Epub 2018 Oct 31. Exp Biol Med (Maywood). 2019. PMID: 30379575 Free PMC article. Review. - Stabilization of membrane topologies by proteinaceous remorin scaffolds.
Su C, Rodriguez-Franco M, Lace B, Nebel N, Hernandez-Reyes C, Liang P, Schulze E, Mymrikov EV, Gross NM, Knerr J, Wang H, Siukstaite L, Keller J, Libourel C, Fischer AAM, Gabor KE, Mark E, Popp C, Hunte C, Weber W, Wendler P, Stanislas T, Delaux PM, Einsle O, Grosse R, Römer W, Ott T. Su C, et al. Nat Commun. 2023 Jan 19;14(1):323. doi: 10.1038/s41467-023-35976-5. Nat Commun. 2023. PMID: 36658193 Free PMC article.
References
- Antonny B. Membrane deformation by protein coats. Curr Opin Cell Biol. 2006;18:386–394. - PubMed
- Zimmerberg J, Kozlov MM. How proteins produce cellular membrane curvature. Nat Rev Mol Cell Biol. 2006;7:9–19. - PubMed
- Takei K, McPherson PS, Schmid SL, De Camilli P. Tubular membrane invaginations coated by dynamin rings are induced by GTP-γ S in nerve terminals. Nature. 1995;374:186–190. - PubMed
Publication types
MeSH terms
Substances
LinkOut - more resources
Full Text Sources
Other Literature Sources


