Wolfram syndrome 1 gene negatively regulates ER stress signaling in rodent and human cells - PubMed (original) (raw)
. 2010 Mar;120(3):744-55.
doi: 10.1172/JCI39678. Epub 2010 Feb 15.
Affiliations
- PMID: 20160352
- PMCID: PMC2827948
- DOI: 10.1172/JCI39678
Wolfram syndrome 1 gene negatively regulates ER stress signaling in rodent and human cells
Sonya G Fonseca et al. J Clin Invest. 2010 Mar.
Abstract
Wolfram syndrome is an autosomal-recessive disorder characterized by insulin-dependent diabetes mellitus, caused by nonautoimmune loss of beta cells, and neurological dysfunctions. We have previously shown that mutations in the Wolfram syndrome 1 (WFS1) gene cause Wolfram syndrome and that WFS1 has a protective function against ER stress. However, it remained to be determined how WFS1 mitigates ER stress. Here we have shown in rodent and human cell lines that WFS1 negatively regulates a key transcription factor involved in ER stress signaling, activating transcription factor 6alpha (ATF6alpha), through the ubiquitin-proteasome pathway. WFS1 suppressed expression of ATF6alpha target genes and repressed ATF6alpha-mediated activation of the ER stress response element (ERSE) promoter. Moreover, WFS1 stabilized the E3 ubiquitin ligase HRD1, brought ATF6alpha to the proteasome, and enhanced its ubiquitination and proteasome-mediated degradation, leading to suppression of ER stress signaling. Consistent with these data, beta cells from WFS1-deficient mice and lymphocytes from patients with Wolfram syndrome exhibited dysregulated ER stress signaling through upregulation of ATF6alpha and downregulation of HRD1. These results reveal a role for WFS1 in the negative regulation of ER stress signaling and in the pathogenesis of diseases involving chronic, unresolvable ER stress, such as pancreatic beta cell death in diabetes.
Figures
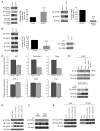
Figure 1. WFS1 interacts with ATF6α in an ER stress–dependent manner and suppresses ATF6α transcriptional activation.
(A) COS7 cells were transfected with a full-length ATF6α expression plasmid or ΔATF6α with a WFS1 plasmid together with the following luciferase reporter genes: ATF6α binding site reporter gene ATF6GL3, ATF6α mutant site reporter ATF6m1GL3, and GRP78 promoter reporter gene ERSE. Relative intensity of luciferase was then measured (n = 3). (B) Protein lysates from the luciferase assay were analyzed by IB using anti-HA (ATF6α), anti-Flag (WFS1), and anti-actin antibodies. ATF6α and ΔATF6α are denoted by single and double asterisks, respectively. (C) COS7 cells were transfected with a full-length ATF6α expression plasmid with a BiP expression plasmid, WFS1 expression plasmid, or WFS1 and BiP expression plasmid together with the GRP78 reporter gene (n = 3). (D) An anti-WFS1 antibody was used to IP WFS1 protein from INS1 832/13 cells untreated (UT) or treated with the ER stress inducer DTT (1 mM) for 0.5, 1.5, or 3 hours. IPs were then subject to IB analysis using anti-ATF6α, anti-WFS1, and anti-actin antibodies (n = 3). (E) INS1 832/13 cells were treated with DTT (1 mM) for 2 hours and then chased in normal media for 0, 1, or 2 hours. WFS1 was subjected to IP from cell lysates, and IPs were analyzed by IB using anti-ATF6α, anti-WFS1, and anti-actin antibodies (n = 3).
Figure 2. WFS1 regulates ATF6α protein levels.
(A) IB analysis measured ATF6α and WFS1 levels in MIN6 cells expressing shGFP (control) or shWFS1, as well as in MIN6 cells expressing shWFS1 or expressing shWFS1 and rescued with WFS1 (n = 3). (B) IB analysis measuring ATF6α, WFS1, IRE1α, and PERK levels in INS1 832/13 cells (treated with 2 mM DTT for 3 hours) overexpressing GFP (control) or WFS1 (n = 3). (C) Quantitative real-time PCR analysis of BiP, total Xbp-1, Chop, Ero1-α, Glut2, and Ins2 mRNA levels in INS1 832/13 cells overexpressing GFP (control) or WFS1 (n = 3). (D) IB analysis of ATF6α and WFS1 in COS7 cells transfected with ATF6α-HA or ATF6α-HA and WFS1-FLAG at 2 different ratios, and in INS1 832/13 cells expressing inducible WFS1 and treated with or without MG132. (E) IB analysis of ATF6α and WFS1 in MIN6 cells expressing shWFS1 and transfected with WT WFS1-FLAG or mutant P724L WFS1-FLAG and G695V WFS1-FLAG (n = 3). (F) IB analysis measuring ATF6α and WFS1 levels in INS1 832/13 cells expressing WT WFS1 or P724L WFS1 (n = 3). (G) WFS1 was subjected to IP from COS7 cells expressing ATF6α-HA or ATF6α-HA with WT, P724L, or G695V WFS1-Flag using an anti-Flag antibody. IPs and input proteins were analyzed using anti-HA and anti-Flag antibodies. **P < 0.01.
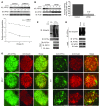
Figure 3. WFS1 enhances ATF6α ubiquitination and degradation.
(A) IB analysis measuring ATF6α, WFS1, and actin levels in MIN6 cells stably expressing shGFP (control) or shWFS1 treated with 40 μM cycloheximide (CX) for 0, 2, and 4 hours (n = 3). (B) IB analysis measuring ATF6α, WFS1, and actin levels in INS1 832/13 cells expressing GFP (control) or WFS1 treated with 40 μM cycloheximide for 0, 2, and 6 hours (n = 3). (C) ATF6α was subjected to IP using an anti-ATF6α antibody from an INS1 832/13 cells inducibly expressing shWFS1 (treated for 48 hours with 2 μM doxycycline) and treated with MG132 (20 μM) for 3 hours. IPs were then subjected to IB with anti-ubiquitin and anti-ATF6α antibodies, and input lysates were blotted with anti-ATF6α, anti-WFS1, and anti-actin antibodies (n = 3). (D) ATF6α was subjected to IP using an anti-ATF6α antibody, from INS1 832/13 cells overexpressing GFP (control) or WFS1, then treated with MG132 (0.1 μM) overnight. IPs were subjected to IB with anti-ubiquitin and anti-ATF6α antibodies. Input lysates were subjected to IB with anti-ATF6α, anti-WFS1, and anti-actin antibodies (n = 3). (E) Wfs1–/– and WT littermate mouse pancreata were analyzed by immunohistochemistry using anti-ATF6α and anti-insulin antibodies. Scale bars: 50 μm.
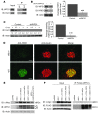
Figure 4. WFS1 forms a complex with the proteasome and ATF6α.
(A) WFS1 was subjected to IP from INS1 832/13 cells using an anti-WFS1 specific antibody. IPs were subjected to IB with anti–alpha 5 20S proteasome and anti-WFS1 antibodies. (B) IB analysis measuring CREB, actin, and PDI levels using whole cell lysates or ER-isolated lysates of INS1 832/13 cells. ER-isolated lysates of INS1 832/13 cells were also subjected to fractionation using a 10%–40% glycerol gradient. Fractions were analyzed by IB using anti–alpha 5 20s proteosome, anti-ATF6α, and anti-WFS1 antibodies. Lanes were run on separate gels and were not contiguous. (C) WFS1 was subjected to IP from a mixture of fractions 10 and 11 using an anti-WFS1 antibody, and IP products were subjected to IB analysis using anti-alpha 5 20s proteosome, anti-ATF6α, and anti-WFS1 antibodies. ATF6 was subjected to IP from a mixture of fractions 9 and 12, and IP products were analyzed by IB with anti–alpha 5 20s proteosome and anti-ATF6α (n = 3).
Figure 5. WFS1 interacts with and stabilizes the E3 ligase HRD1.
(A) Hrd1 was subjected to IP from INS1 832/13 cells, and IPs were subjected to IB analysis using anti-WFS1 and anti-Hrd1 antibodies (n = 3). (B) Total lysates from INS1 832/13 cells inducibly expressing shWFS1 (treated with 2 μM doxycycline for 48 hours) were analyzed by IB using anti-WFS1, anti-Hrd1, and anti-actin antibodies (n = 3). (C) IB analysis measuring HRD1 levels in MIN6 cells stably expressing shGFP (control) or shWFS1 treated with 40 μM cycloheximide for 0, 0.5, 1, and 2 hours (n = 3). (D) Wfs1–/– and WT littermate mouse pancreata were analyzed by immunohistochemistry using anti-HRD1 and anti-insulin antibodies (n = 3). Scale bars: 100 μm. (E) COS7 cells were transfected with pcDNA3, HRD1–c-Myc, HRD1–c-Myc and WT WFS1, or HRD1–c-Myc and WFS1 mutants (P724L, G695V, and ins483fs/ter544) expression plasmids. Expression levels of HRD1–c-Myc, WFS1, and actin were measured by IB using anti–c-Myc, anti-WFS1, and anti-actin antibodies, respectively. WT and mutant WFS1 are denoted by single and double asterisks, respectively. (F) COS7 cells were transfected with pcDNA3, HRD1–c-Myc, HRD1–c-Myc and WT WFS1-Flag, HRD1–c-Myc and WFS P724L-Flag, and HRD1–c-Myc and WFS1 G695V-Flag expression plasmids. The lysates were subjected to IP with anti-Flag antibody and IB with anti–c-Myc antibody to study the interaction between HRD1 and WFS1.
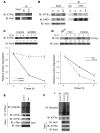
Figure 6. HRD1 is an E3 ligase for ATF6α.
(A) HRD1 was subjected to IP from INS1 832/13 cells treated for 3 hours with 30 μM MG132. IPs and input proteins were analyzed by IB using anti-ATF6α and anti-HRD1 antibodies. Lanes were run on the same gel but were noncontiguous (white line). (B) An anti-HRD1 antibody was used to IP HRD1 protein from INS1 832/13 cells untreated or treated with DTT (1 mM) and thapsigargin (Tg; 1 μM) for 3 hours. IPs were then subjected to IB analysis using anti-ATF6α, anti-HRD1, and anti-actin antibodies (n = 3). (C) IB analysis measuring ATF6α levels in MIN6 cells stably expressing shGFP (control) or shRNA shHRD1 treated with 40 μM cycloheximide for 0, 4, and 6 hours (n = 3). (D) COS7 cells transfected with ATF6α-HA expression plasmid (control) or ATF6α-HA together with Hrd1-myc expression plasmids (Hrd1) were treated with 40 μM cycloheximide for 0, 4, and 6 hours. Whole cell lysates were subjected to IB with an anti-HA antibody (n = 3). (E) ATF6α was subjected to IP using an anti-ATF6α antibody from INS1 832/13 cells either mock transfected (control) or transfected with a Hrd1-Myc expression plasmid and treated with MG132 (20 μM) for 3 hours. IPs were then subjected to IB with anti-ubiquitin and anti-ATF6α antibodies, and input lysates were blotted with anti-ATF6α, anti–c-Myc, and anti-actin antibodies (n = 3). (F) ATF6 was subjected to IP using an anti-ATF6α antibody from MIN6 cells stably expressing shGFP (control) or shHRD1 and treated with MG132 (20 μM) for 3 hours. IPs were then subjected to IB with anti-ubiquitin and anti-ATF6α antibodies, and input lysates were blotted with anti-HRD1, anti-ATF6α, and anti-actin antibodies (n = 3).
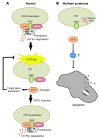
Figure 7. WFS1 controls steady-state levels of ATF6α protein and activation.
(A) In normal cells, WFS1 recruits the ER transcription factor ATF6α to the E3 ligase Hrd1 under non–ER stress conditions. Hrd1 marks ATF6α with ubiquitin for proteasomal degradation. Under ER stress, ATF6α dissociates from WFS1 and undergoes proteolysis, and its soluble aminoportion, p60ATF6α, translocates to the nucleus, where it upregulates ER stress target genes, such as BiP, CHOP, and XBP-1. At later time points, WFS1 is induced by ER stress, which causes the eventual degradation of ATF6α. (B) In patients with Wolfram syndrome or Wfs1–/– mice, ATF6α escapes from the proteasome-dependent degradation, leading to chronic hyperactivation of ATF6α signaling. This ATF6α hyperactivation is involved in apoptosis through apoptotic effectors of the UPR, such as CHOP.
Similar articles
- The E3 ligase Smurf1 regulates Wolfram syndrome protein stability at the endoplasmic reticulum.
Guo X, Shen S, Song S, He S, Cui Y, Xing G, Wang J, Yin Y, Fan L, He F, Zhang L. Guo X, et al. J Biol Chem. 2011 May 20;286(20):18037-47. doi: 10.1074/jbc.M111.225615. Epub 2011 Mar 28. J Biol Chem. 2011. PMID: 21454619 Free PMC article. - ATF6β regulates the Wfs1 gene and has a cell survival role in the ER stress response in pancreatic β-cells.
Odisho T, Zhang L, Volchuk A. Odisho T, et al. Exp Cell Res. 2015 Jan 1;330(1):111-22. doi: 10.1016/j.yexcr.2014.10.007. Epub 2014 Oct 16. Exp Cell Res. 2015. PMID: 25447309 - Loss of Function of WFS1 Causes ER Stress-Mediated Inflammation in Pancreatic Beta-Cells.
Morikawa S, Blacher L, Onwumere C, Urano F. Morikawa S, et al. Front Endocrinol (Lausanne). 2022 Mar 25;13:849204. doi: 10.3389/fendo.2022.849204. eCollection 2022. Front Endocrinol (Lausanne). 2022. PMID: 35399956 Free PMC article. - Developmental hypomyelination in Wolfram syndrome: new insights from neuroimaging and gene expression analyses.
Samara A, Rahn R, Neyman O, Park KY, Samara A, Marshall B, Dougherty J, Hershey T. Samara A, et al. Orphanet J Rare Dis. 2019 Dec 3;14(1):279. doi: 10.1186/s13023-019-1260-9. Orphanet J Rare Dis. 2019. PMID: 31796109 Free PMC article. Review. - Endoplasmic reticulum stress in beta-cells and development of diabetes.
Fonseca SG, Burcin M, Gromada J, Urano F. Fonseca SG, et al. Curr Opin Pharmacol. 2009 Dec;9(6):763-70. doi: 10.1016/j.coph.2009.07.003. Epub 2009 Aug 6. Curr Opin Pharmacol. 2009. PMID: 19665428 Free PMC article. Review.
Cited by
- A mathematical model of the unfolded protein stress response reveals the decision mechanism for recovery, adaptation and apoptosis.
Erguler K, Pieri M, Deltas C. Erguler K, et al. BMC Syst Biol. 2013 Feb 21;7:16. doi: 10.1186/1752-0509-7-16. BMC Syst Biol. 2013. PMID: 23433609 Free PMC article. - Multidimensional analysis and therapeutic development using patient iPSC-derived disease models of Wolfram syndrome.
Kitamura RA, Maxwell KG, Ye W, Kries K, Brown CM, Augsornworawat P, Hirsch Y, Johansson MM, Weiden T, Ekstein J, Cohen J, Klee J, Leslie K, Simeonov A, Henderson MJ, Millman JR, Urano F. Kitamura RA, et al. JCI Insight. 2022 Sep 22;7(18):e156549. doi: 10.1172/jci.insight.156549. JCI Insight. 2022. PMID: 36134655 Free PMC article. - Clinical Spectrum Associated with Wolfram Syndrome Type 1 and Type 2: A Review on Genotype-Phenotype Correlations.
Delvecchio M, Iacoviello M, Pantaleo A, Resta N. Delvecchio M, et al. Int J Environ Res Public Health. 2021 Apr 30;18(9):4796. doi: 10.3390/ijerph18094796. Int J Environ Res Public Health. 2021. PMID: 33946243 Free PMC article. Review. - Altered β-Cell Prohormone Processing and Secretion in Type 1 Diabetes.
Rodriguez-Calvo T, Chen YC, Verchere CB, Haataja L, Arvan P, Leete P, Richardson SJ, Morgan NG, Qian WJ, Pugliese A, Atkinson M, Evans-Molina C, Sims EK. Rodriguez-Calvo T, et al. Diabetes. 2021 May;70(5):1038-1050. doi: 10.2337/dbi20-0034. Epub 2021 May 4. Diabetes. 2021. PMID: 33947721 Free PMC article. Review. - Endoplasmic reticulum stress and Parkinson's disease: the role of HRD1 in averting apoptosis in neurodegenerative disease.
Omura T, Kaneko M, Okuma Y, Matsubara K, Nomura Y. Omura T, et al. Oxid Med Cell Longev. 2013;2013:239854. doi: 10.1155/2013/239854. Epub 2013 Apr 18. Oxid Med Cell Longev. 2013. PMID: 23710284 Free PMC article. Review.
References
Publication types
MeSH terms
Substances
LinkOut - more resources
Full Text Sources
Other Literature Sources
Molecular Biology Databases

