An optoelectronic nose for the detection of toxic gases - PubMed (original) (raw)
An optoelectronic nose for the detection of toxic gases
Sung H Lim et al. Nat Chem. 2009 Oct.
Abstract
We have developed a simple colorimetric sensor array that detects a wide range of volatile analytes and then applied it to the detection of toxic gases. The sensor consists of a disposable array of cross-responsive nanoporous pigments with colours that are changed by diverse chemical interactions with analytes. Although no single chemically responsive pigment is specific for any one analyte, the pattern of colour change for the array is a unique molecular fingerprint. Clear differentiation among 19 different toxic industrial chemicals (TICs) within two minutes of exposure at concentrations immediately dangerous to life or health were demonstrated. Based on the colour change of the array, quantification of each analyte was accomplished easily, and excellent detection limits were achieved, generally below the permissible exposure limits. Different TICs were identified readily using a standard chemometric approach (hierarchical clustering analysis), with no misclassifications over 140 trials.
Conflict of interest statement
Competing financial interests
K.S.S. discloses his status as a major shareholder of ChemSensing, whose software was used in image analysis in this work, and in iSense LLC, employer of one of the co-authors (S.H.L).
Figures
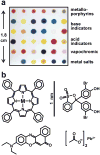
Fig. 1. The colorimetric sensor array (CSA) consists of 36 different chemically responsive pigments that have been printed directly on a polyethylene terephthalate (PET) film
a An image of the array from an ordinary flatbed scanner with the different pigment classes labeled. b. Molecular structures of examples from each dye class are shown; in order to absorb visible light, dyes are inherently nanoscale, as noted by the scale bar. The 36 dyes were selected empirically based on the quality of their color response to a representative selection of chemically diverse analytes.
Fig. 2. Color change profiles of representative toxic industrial chemicals (TICs) at their IDLH (immediately dangerous to life or health) concentration after 2 min of exposure
The IDLH concentrations are listed under each analyte in ppm. A full digital database is provided in the Supplementary Table S3. For display purposes, the color range of these difference maps are expanded from 4 to 8 bits per color (RGB range of 4–19 expanded to 0–255).
Fig. 3. The effect of concentration on array response to NH3, Cl2, and SO2
The color change profiles of these three representative TICs are shown over roughly a hundred-fold range of concentration. The observed limits of detection (LOD) are well below the PEL (permissible exposure limit). For display purposes, the color range of these difference maps are expanded from 4 to 8 bits per color (RGB range of 4–19 expanded to 0–255), except for SO2 at 1 ppm (RGB range of 2–7).
Fig. 4. Response time of the array
Total Euclidean distance of the array is plotted versus time for five representative TICs at their IDLH concentrations; the average of seven trials is shown. The Euclidean distance is simply the total length of the 108-dimensional color difference vector, i.e., the total array response.
Fig. 5. Reversibility of colorimetric array response
a, SO2 exposure of the array from N2 to the IDLH (100 ppm) level, and then repeatedly from the IDLH to PEL (5 ppm) and back. b, Cl2 exposure of the array from N2 to the IDLH (10 ppm) level, and then repeatedly from the IDLH to PEL (1 ppm) and back. Data was acquired every min. The response times in this data reflect the dead volume in the gas mixing system and do not represent the intrinsic response of the array (which is shown in Fig. 4). The error bars shown are the standard deviation of triplicate trials.
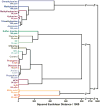
Fig. 6. Hierarchical cluster analysis (HCA) for 19 TICs at IDLH concentrations and a control
HCA is a routine model-free statistical classification method based on Euclidean distance–. In these experiments, the Euclidean distances are defined by the color difference vectors of each experimental trial in the full 108-dimensional space made up of the changes in red, green, and blue values of the 36 nanoporous pigments in the sensor array. As shown, all experiments were run in septuplicate: no confusions or errors in classification were observed in 140 trials. The IDLH concentrations of each analyte are shown in ppm. The HCA used minimum variance (i.e., “Ward’s Method”) for clustering.
Similar articles
- Colorimetric sensor array for determination and identification of toxic industrial chemicals.
Feng L, Musto CJ, Kemling JW, Lim SH, Zhong W, Suslick KS. Feng L, et al. Anal Chem. 2010 Nov 15;82(22):9433-40. doi: 10.1021/ac1020886. Epub 2010 Oct 18. Anal Chem. 2010. PMID: 20954720 - A colorimetric sensor array for identification of toxic gases below permissible exposure limits.
Feng L, Musto CJ, Kemling JW, Lim SH, Suslick KS. Feng L, et al. Chem Commun (Camb). 2010 Mar 28;46(12):2037-9. doi: 10.1039/b926848k. Epub 2010 Feb 11. Chem Commun (Camb). 2010. PMID: 20221484 Free PMC article. - A colorimetric sensor array of porous pigments.
Lim SH, Kemling JW, Feng L, Suslick KS. Lim SH, et al. Analyst. 2009 Dec;134(12):2453-7. doi: 10.1039/b916571a. Epub 2009 Oct 21. Analyst. 2009. PMID: 19918616 Free PMC article. - The Optoelectronic Nose: Colorimetric and Fluorometric Sensor Arrays.
Li Z, Askim JR, Suslick KS. Li Z, et al. Chem Rev. 2019 Jan 9;119(1):231-292. doi: 10.1021/acs.chemrev.8b00226. Epub 2018 Sep 12. Chem Rev. 2019. PMID: 30207700 Review. - Mitigation of Humidity Interference in Colorimetric Sensing of Gases.
Yu J, Wang D, Tipparaju VV, Tsow F, Xian X. Yu J, et al. ACS Sens. 2021 Feb 26;6(2):303-320. doi: 10.1021/acssensors.0c01644. Epub 2020 Oct 21. ACS Sens. 2021. PMID: 33085469 Free PMC article. Review.
Cited by
- M13 Bacteriophage-Based Self-Assembly Structures and Their Functional Capabilities.
Moon JS, Kim WG, Kim C, Park GT, Heo J, Yoo SY, Oh JW. Moon JS, et al. Mini Rev Org Chem. 2015 Jun;12(3):271-281. doi: 10.2174/1570193X1203150429105418. Mini Rev Org Chem. 2015. PMID: 26146494 Free PMC article. - Improvement in NO2 Gas Sensing Properties of Semiconductor-Type Sensors by Loading Pt into BiVO4 Nanocomposites at Room Temperature.
Lin WD, Lin SY, Chavali M. Lin WD, et al. Materials (Basel). 2021 Oct 9;14(20):5913. doi: 10.3390/ma14205913. Materials (Basel). 2021. PMID: 34683505 Free PMC article. - A review on machine learning-powered fluorescent and colorimetric sensor arrays for bacteria identification.
Yang C, Zhang H. Yang C, et al. Mikrochim Acta. 2023 Oct 25;190(11):451. doi: 10.1007/s00604-023-06021-5. Mikrochim Acta. 2023. PMID: 37880465 Review. - Exhaled breath analysis with a colorimetric sensor array for the identification and characterization of lung cancer.
Mazzone PJ, Wang XF, Xu Y, Mekhail T, Beukemann MC, Na J, Kemling JW, Suslick KS, Sasidhar M. Mazzone PJ, et al. J Thorac Oncol. 2012 Jan;7(1):137-42. doi: 10.1097/JTO.0b013e318233d80f. J Thorac Oncol. 2012. PMID: 22071780 Free PMC article. Clinical Trial. - Mimicking biological design and computing principles in artificial olfaction.
Raman B, Stopfer M, Semancik S. Raman B, et al. ACS Chem Neurosci. 2011 May 27;2(9):487-499. doi: 10.1021/cn200027r. ACS Chem Neurosci. 2011. PMID: 22081790 Free PMC article.
References
- Byrnes ME, King DA, Tierno PM., Jr . Nuclear, Chemical, and Biological Terrorism—Emergency Response and Public Protection. CRC Press; Boca Raton, FL: 2003.
- Suslick KS, et al. Seeing smells: development of an optoelectronic nose. Quimica Nova. 2007;30:677–681.
- Suslick KS. An optoelectronic nose: seeing smells by means of colorimetric sensor arrays. MRS Bulletin. 2004;29:720–725. - PubMed
- Suslick KS, Rakow NA, Sen A. Colorimetric sensor arrays for molecular recognition. Tetrahedron. 2004;60:11133–11138.
- Rakow NA, Suslick KS. A colorimetric sensor array for odour visualization. Nature. 2000;406:710–713. - PubMed
Publication types
MeSH terms
Substances
LinkOut - more resources
Full Text Sources
Other Literature Sources


