BisoGenet: a new tool for gene network building, visualization and analysis - PubMed (original) (raw)
BisoGenet: a new tool for gene network building, visualization and analysis
Alexander Martin et al. BMC Bioinformatics. 2010.
Abstract
Background: The increasing availability and diversity of omics data in the post-genomic era offers new perspectives in most areas of biomedical research. Graph-based biological networks models capture the topology of the functional relationships between molecular entities such as gene, protein and small compounds and provide a suitable framework for integrating and analyzing omics-data. The development of software tools capable of integrating data from different sources and to provide flexible methods to reconstruct, represent and analyze topological networks is an active field of research in bioinformatics.
Results: BisoGenet is a multi-tier application for visualization and analysis of biomolecular relationships. The system consists of three tiers. In the data tier, an in-house database stores genomics information, protein-protein interactions, protein-DNA interactions, gene ontology and metabolic pathways. In the middle tier, a global network is created at server startup, representing the whole data on bioentities and their relationships retrieved from the database. The client tier is a Cytoscape plugin, which manages user input, communication with the Web Service, visualization and analysis of the resulting network.
Conclusion: BisoGenet is able to build and visualize biological networks in a fast and user-friendly manner. A feature of Bisogenet is the possibility to include coding relations to distinguish between genes and their products. This feature could be instrumental to achieve a finer grain representation of the bioentities and their relationships. The client application includes network analysis tools and interactive network expansion capabilities. In addition, an option is provided to allow other networks to be converted to BisoGenet. This feature facilitates the integration of our software with other tools available in the Cytoscape platform. BisoGenet is available at http://bio.cigb.edu.cu/bisogenet-cytoscape/.
Figures
Figure 1
BisoGenet general system architecture. At the client tier a Plugin wrapper component provides a user interface for setting input options, sending request to the server and showing the results. This component is supported on BisoGenet Client API, which provides programmatic access to the Server and implements some functionality for managing the results. At the middle tier, the BisoGenet Service Façade, a J2EE based component, exposes the functionalities contained in the Core component through the web service technology. This Core component is implemented in C++. At the data tier SysBiomics, a PostgreSQL-managed database, integrates information on genes, proteins, protein-protein and protein-DNA interactions, gene ontologies and metabolic pathways from multiple sources.
Figure 2
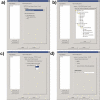
BisoGenet Client input options. Screenshots of Bisogenet input options. The text box on the left enables introducing a list of identifiers. a) Identifiers tab: a combobox allows choosing the organism to which the query genes/proteins belong to and the type of biological entities to be identified: genes only, proteins only or both. b) Data Settings: a tree component enables choosing data sources and the type of experimental methods to be considered. c) Method tab: it gives two alternatives for network building, first to build a network considering as nodes only those gene/proteins identified from the input list and second to build a network that includes in addition to those identified from the input list, neighbors located up to a distances of N edges (N is defined by the user). d) Output tab: It allows the user to choose network representation in terms of genes, proteins or both with coding relations.
Figure 3
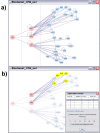
Creating, expanding and analyzing a BisoGenet network. a) Process of creating and expanding a network. The dashed lines divide the input node from the results; first, of creating a network and second of expanding it. First, CPM identifier is given by the user and a network is created by choosing to include neighbours up to a distance of 1 edge. Next the resulting network is expanded by choosing the added nodes and applying the same method as in first step. b) An example of the use of BisoGenet option for finding equivalent nodes or nodes with the same set of neighbors. A list of set of equivalents nodes is displayed with the number of equivalences and nodes in the set. Components of each set can be highlighted in the network by placing the cursor on it, additionally a transparency filter can be applied and the set of common nodes can be also highlighted.
Figure 4
Representing coding relations. Partial view of a network created with gene name "hla-a" as input and choosing to add node up to a distance of one. The input node HLA-A, in red, represents a gene with multiple splice variants. The node UBIQ_HUMAN, in yellow, represent a protein coded by multiple genes. The output was chosen to include coding relation. Dashed lines with arrows represent coding relations directed from the gene node to protein nodes coded by each of the splice variants. BisoGenet assigns a distance of zero to coding relations. Solid lines represent protein-protein interaction networks.
Similar articles
- GenePro: a Cytoscape plug-in for advanced visualization and analysis of interaction networks.
Vlasblom J, Wu S, Pu S, Superina M, Liu G, Orsi C, Wodak SJ. Vlasblom J, et al. Bioinformatics. 2006 Sep 1;22(17):2178-9. doi: 10.1093/bioinformatics/btl356. Bioinformatics. 2006. PMID: 16921162 - Biana: a software framework for compiling biological interactions and analyzing networks.
Garcia-Garcia J, Guney E, Aragues R, Planas-Iglesias J, Oliva B. Garcia-Garcia J, et al. BMC Bioinformatics. 2010 Jan 27;11:56. doi: 10.1186/1471-2105-11-56. BMC Bioinformatics. 2010. PMID: 20105306 Free PMC article. - BioNetBuilder: automatic integration of biological networks.
Avila-Campillo I, Drew K, Lin J, Reiss DJ, Bonneau R. Avila-Campillo I, et al. Bioinformatics. 2007 Feb 1;23(3):392-3. doi: 10.1093/bioinformatics/btl604. Epub 2006 Nov 30. Bioinformatics. 2007. PMID: 17138585 - Tools for visually exploring biological networks.
Suderman M, Hallett M. Suderman M, et al. Bioinformatics. 2007 Oct 15;23(20):2651-9. doi: 10.1093/bioinformatics/btm401. Epub 2007 Aug 25. Bioinformatics. 2007. PMID: 17720984 Review. - Graphs in molecular biology.
Huber W, Carey VJ, Long L, Falcon S, Gentleman R. Huber W, et al. BMC Bioinformatics. 2007 Sep 27;8 Suppl 6(Suppl 6):S8. doi: 10.1186/1471-2105-8-S6-S8. BMC Bioinformatics. 2007. PMID: 17903289 Free PMC article. Review.
Cited by
- Gender-related differentially expressed genes in pancreatic cancer: possible culprits or accomplices?
Ramezankhani R, Ghavidel AA, Rashidi S, Rojhannezhad M, Abolkheir HR, Mirhosseini M, Taleahmad S, Vosough M. Ramezankhani R, et al. Front Genet. 2022 Oct 26;13:966941. doi: 10.3389/fgene.2022.966941. eCollection 2022. Front Genet. 2022. PMID: 36386839 Free PMC article. - Quantitative proteomics reveals the induction of mitophagy in tumor necrosis factor-α-activated (TNFα) macrophages.
Bell C, English L, Boulais J, Chemali M, Caron-Lizotte O, Desjardins M, Thibault P. Bell C, et al. Mol Cell Proteomics. 2013 Sep;12(9):2394-407. doi: 10.1074/mcp.M112.025775. Epub 2013 May 14. Mol Cell Proteomics. 2013. PMID: 23674617 Free PMC article. - Systems biological approach to investigate the lack of familial link between Down's Syndrome & Neural Tube Disorders.
Ragunath P, Abhinand P. Ragunath P, et al. Bioinformation. 2013 Jul 12;9(12):610-6. doi: 10.6026/97320630009610. Print 2013. Bioinformation. 2013. PMID: 23904737 Free PMC article. - Virtual interactomics of proteins from biochemical standpoint.
Kubrycht J, Sigler K, Souček P. Kubrycht J, et al. Mol Biol Int. 2012;2012:976385. doi: 10.1155/2012/976385. Epub 2012 Aug 8. Mol Biol Int. 2012. PMID: 22928109 Free PMC article. - The Chinese herbal formula Fuzheng Quxie Decoction attenuates cognitive impairment and protects cerebrovascular function in SAMP8 mice.
Wang F, Feng J, Yang Y, Liu J, Liu M, Wang Z, Pei H, Wei Y, Li H. Wang F, et al. Neuropsychiatr Dis Treat. 2018 Nov 9;14:3037-3051. doi: 10.2147/NDT.S175484. eCollection 2018. Neuropsychiatr Dis Treat. 2018. PMID: 30519025 Free PMC article.
References
Publication types
MeSH terms
Substances
LinkOut - more resources
Full Text Sources


