Acute and gradual increases in BDNF concentration elicit distinct signaling and functions in neurons - PubMed (original) (raw)
Acute and gradual increases in BDNF concentration elicit distinct signaling and functions in neurons
Yuanyuan Ji et al. Nat Neurosci. 2010 Mar.
Abstract
Extracellular factors may act on cells in two distinct modes: an acute increase in concentration as a result of regulated secretion, or a gradual increase in concentration when secreted constitutively or from a distant source. We found that cellular responses to brain-derived neurotrophic factor (BDNF) differed markedly depending on how BDNF was delivered. In cultured rat hippocampal neurons, acute and gradual increases in BDNF elicited transient and sustained activation of TrkB receptor and its downstream signaling, respectively, leading to differential expression of Homer1 and Arc. Transient TrkB activation promoted neurite elongation and spine head enlargement, whereas sustained TrkB activation facilitated neurite branch and spine neck elongation. In hippocampal slices, fast and slow increases in BDNF enhanced basal synaptic transmission and LTP, respectively. Thus, the kinetics of TrkB activation is critical for cell signaling and functions. This temporal dimension in cellular signaling may also have implications for the therapeutic drug design.
Figures
Figure 1
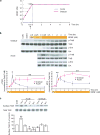
Transient or sustained TrkB activation and Erk signaling induced by acute or gradual BDNF stimulation. (a) Protocols for application of BDNF in acute and gradual modes. Hippocampal neurons were cultured for 14 days. In the acute protocol, BDNF concentration in the culture increased immediately from 0 to 1 nM (25 ng/ml). Neuronal proteins were extracted at 0, 0.25, 0.5, 1, 2, 4, 8 hours after BDNF application. In the gradual protocol, BDNF concentration increased tenfold in every 30 min, starting from 10−4 nM (2.5 pg/ml) until it reached 1 nM (25 ng/ml; total 2 hours). Protein extraction started at 30 min after 10−2 nM (0.25 ng/ml) BDNF application (1.5 hr after the first BDNF application, indicated by arrow). When BDNF concentration reached 1 nM (25 ng/ml), protein extraction followed the same time course. (b) Transient and sustained activations of TrkB and Erk induced by acute and gradual stimulation with BDNF, respectively. Representative Western blots are shown on top of the quantitative plots. The pTrkB and pErk signals were measured by densitometry, normalized to total TrkB and Erk respectively, and data from 6 independent experiments (N = 6) were averaged and plotted. CON: vehicle control. Saline: 5 consecutive times of saline treatment with 30 min interval as a negative control. Data obtained from acute (blue line) and gradual (pink line) experiments in Fig. 1b, Fig. 2 and Fig. 6 were compared by paired t-test. In this and all other figures, data are presented as mean ± SEM, *: p < 0.05, **: p < 0.01. (c) Biotinylation assay of surface TrkB at the indicated time points after acute and gradual BDNF treatment. Data were compared to control by ANOVA.
Figure 2
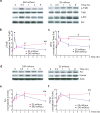
Differential expression of Homer1a and Arc by acute and gradual modes of BDNF stimulation. Representative Western blots (a) and quantitative plots (b) of the time courses of BDNF-induced Homer1a, Arc expression in acute and gradual modes. Actin was used as loading control.
Figure 3
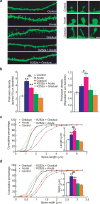
Differential effects of acute and gradual modes on neurite growth of young neurons. (a) Representative images of MAP2-stained hippocampal neurons under different conditions. Neurons (DIV 3) were treated with BDNF in acute or gradual mode. Three days later, neurons were fixed and stained with anti-MAP2 antibody. Scale bar, 20 μm. (b) Effects of acute and gradual BDNF stimulation on neurite growth. These responses were completely inhibited when the cells were pretreated for 1 h with 100 nM K252a. Total neurite length, number of primary neurites, and number of branch points were analyzed. Data in Fig. 3 to Fig. 5 were compared by ANOVA.
Figure 4
Acute and gradual modulation of dendritic spine growth of mature neurons. (a) Examples showing dendritic spines under different conditions. Acute BDNF stimulation increased the size of spine head, whereas gradual stimulation caused spine length elongation and more filopodia-like protrusions. These responses were completely inhibited when the cells were pretreated for 1 h with 100 nM K252a. Scale bars: low magnification, 5 μm and high magnification, 1 μm. (b) Quantification of spine (left) and filopodia (right) densities (number per 10 μm dendrite length). In each experiment, 40 secondary dendrites from 40 neurons were analyzed. Five independent experiments were performed. (c, d) Quantification of the shape of dendritic spines under the indicated modes. Cumulative frequency plots showing distribution of spine length (μm) and spine head width (μm). More than 500 spines in more than 12 neurons were examined for each treatment, and 5 experiments were performed. The average spine width and length for each group are shown in the insets. **: compared to control group, p< 0.01; #: considered significant between acute and gradual, p< 0.05; ##: significantly different between acute and gradual, p< 0.01, ANOVA.
Figure 5
Differential signaling of fast and slow BDNF stimulation in hippocampal slices. (a–c) Differential kinetics of TrkB and Erk activation induced by fast and slow rates of BDNF stimulation. The CA1 areas from adult hippocampal slices were quickly dissected at the indicated time points after slow (25 ml/hour) or fast (240 ml/hour) BDNF (8 nM, 200 ng/ml) perfusion. TrkB and Erks were used as loading controls. Representative Western blots (a) and quantitative plots (b–c) are presented. n = 3–5 slices/time point. N = 3 independent experiments. (d–f) Differential expression of Homer1a and Arc in adult hippocampal slices induced by slow and fast BDNF perfusion. The experiments were performed identically as in (a). Representative Western blots (d) and quantification of data (e–f) (N = 3 repetitions of pooled slices) are shown. The same experiment was repeated using entirely independent samples, and the same results were obtained.
Figure 6
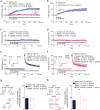
Differential physiological effects of fast and slow BDNF stimulation in hippocampal slices. (a) Comparison of slow and fast BDNF perfusion in adult hippocampal slices. Field EPSPs were recorded at the CA1 area of adult (8-week old) hippocampal slices. After a stable baseline was established, BDNF was perfused into the slices at either fast or slow rate throughout the recording (> 3 hours). Insets are example recordings at 0 min (dotted line) and 180 min (solid line). Note that fast but not slow perfusion of BDNF potentiated synaptic efficacy (153 ± 5% vs. 101 ± 1% at 175–180 min, respectively). (b) Effect of transient, fast BDNF perfusion on adult hippocampal slices. The experiments were done identically as in (a), except that BDNF was transiently perfused at a fast rate as indicated by the horizontal bar. Insets are example recordings at 0 min (dotted line) and 180 min (solid line). Note a significant increase in basal synaptic transmission that lasted even after BDNF was removed (149 ± 8% at 175–180min). (c and d) Fast and slow perfusion of BDNF does not alter basal synaptic transmission in neonatal hippocampal slices. (e, g) Effect of fast BDNF perfusion on neonatal hippocampal slices. The experiments were performed identically as in (a), except that p12–14 slices were used. (e) Fast perfusion of BDNF did not affect E-LTP induced by 3xTBS (131 ± 4% for BDNF and 128 ± 5% for control). Insets are sample recordings at 0 min (dotted line) and 120 min (solid line). (g) Synaptic fatigue during 3xTBS was indistinguishable between BDNF and control (45 ± 5% vs. 47 ± 7%, respectively; measured by the ratio of last response to the first response). Original data are shown on the left. (f, h) Effect of slow BDNF perfusion on neonatal hippocampal slices. (f) Slow perfusion of BDNF significantly increased E-LTP (150 ± 4% at 115–120min) compared to control (130 ± 2%, p<0.001). However, this increase was blocked by co-perfusion of 200 nM K252a (127 ± 6%). Insets are example recordings at 0 min (dotted line) and 120 min (solid line). (h) Synaptic fatigue during 3xTBS was significantly attenuated by BDNF (71 ± 8%) compared to BSA control or co-perfusion of K252a (38 ± 6% and 42 ± 5%, respectively; * p<0.01, ANOVA). Original data are shown on the left.
Figure 7
Differential regulation of NMDAR-EPSCs and AMPAR/NMDAR ratio by fast and slow BDNF application. Whole-cell, voltage-clamp recordings were performed on CA1 pyramidal neurons of hippocampal slices. BSA or BDNF was perfused at slow (25 ml/hr) or fast (240 ml/hr) rate. (a, b, d and e) Representative traces of NMDAR (upper) and AMPAR (lower) currents evoked by extracellular stimulating presynaptic neurons at 50 μA in 2- and 8-week old animals. Black: individual current traces; Red: average waveform. Shaded grey and green rectangular areas indicate where measurements were taken to determine AMPA (at −70 mV) and NMDA (at +50 mV) current amplitudes, respectively. (c) NMDAR currents in 2-week old slices. Note that the average amplitude was significantly increased (p=0.009) after fast but not slow BDNF perfusion. (f) No differences in NMDAR currents were observed between fast and slow BDNF application in 8-week old CA1 neurons. (g) AMPA/NMDA current ratio in 8-week old CA1 neurons. The ratio was significantly increased (p<0.05) after fast but not slow BDNF perfusion.
Similar articles
- Blockade of BDNF signaling turns chemically-induced long-term potentiation into long-term depression.
Montalbano A, Baj G, Papadia D, Tongiorgi E, Sciancalepore M. Montalbano A, et al. Hippocampus. 2013 Oct;23(10):879-89. doi: 10.1002/hipo.22144. Epub 2013 Jun 26. Hippocampus. 2013. PMID: 23674394 - Differential effects of transient and sustained activation of BDNF-TrkB signaling.
Guo W, Nagappan G, Lu B. Guo W, et al. Dev Neurobiol. 2018 Jul;78(7):647-659. doi: 10.1002/dneu.22592. Epub 2018 Mar 31. Dev Neurobiol. 2018. PMID: 29575722 Review. - Cyclic AMP controls BDNF-induced TrkB phosphorylation and dendritic spine formation in mature hippocampal neurons.
Ji Y, Pang PT, Feng L, Lu B. Ji Y, et al. Nat Neurosci. 2005 Feb;8(2):164-72. doi: 10.1038/nn1381. Epub 2005 Jan 23. Nat Neurosci. 2005. PMID: 15665879 - Regulation of Dendritic Spine Morphology in Hippocampal Neurons by Copine-6.
Burk K, Ramachandran B, Ahmed S, Hurtado-Zavala JI, Awasthi A, Benito E, Faram R, Ahmad H, Swaminathan A, McIlhinney J, Fischer A, Perestenko P, Dean C. Burk K, et al. Cereb Cortex. 2018 Apr 1;28(4):1087-1104. doi: 10.1093/cercor/bhx009. Cereb Cortex. 2018. PMID: 28158493 - BDNF mechanisms in late LTP formation: A synthesis and breakdown.
Panja D, Bramham CR. Panja D, et al. Neuropharmacology. 2014 Jan;76 Pt C:664-76. doi: 10.1016/j.neuropharm.2013.06.024. Epub 2013 Jul 2. Neuropharmacology. 2014. PMID: 23831365 Review.
Cited by
- Ghrelin promotes reorganization of dendritic spines in cultured rat hippocampal slices.
Berrout L, Isokawa M. Berrout L, et al. Neurosci Lett. 2012 May 16;516(2):280-4. doi: 10.1016/j.neulet.2012.04.009. Epub 2012 Apr 10. Neurosci Lett. 2012. PMID: 22516464 Free PMC article. - Quantitative analysis of BDNF/TrkB protein and mRNA in cortical and striatal neurons using α-tubulin as a normalization factor.
Ma B, Savas JN, Chao MV, Tanese N. Ma B, et al. Cytometry A. 2012 Aug;81(8):704-17. doi: 10.1002/cyto.a.22073. Epub 2012 May 30. Cytometry A. 2012. PMID: 22649026 Free PMC article. - The κ-opioid receptor-induced autophagy is implicated in stress-driven synaptic alterations.
Karoussiotis C, Sotiriou A, Polissidis A, Symeonof A, Papavranoussi-Daponte D, Nikoletopoulou V, Georgoussi Z. Karoussiotis C, et al. Front Mol Neurosci. 2022 Nov 16;15:1039135. doi: 10.3389/fnmol.2022.1039135. eCollection 2022. Front Mol Neurosci. 2022. PMID: 36466809 Free PMC article. - Rapid enrichment of presynaptic protein in boutons undergoing classical conditioning is mediated by brain-derived neurotrophic factor.
Li W, Keifer J. Li W, et al. Neuroscience. 2012 Feb 17;203:50-8. doi: 10.1016/j.neuroscience.2011.12.015. Epub 2011 Dec 22. Neuroscience. 2012. PMID: 22202461 Free PMC article. - IGFBP2 Plays an Essential Role in Cognitive Development during Early Life.
Khan S, Lu X, Huang Q, Tang J, Weng J, Yang Z, Lv M, Xu X, Xia F, Zhang M, Li Y, Liu S, Leng G, Spitzer N, Du J, Chen X. Khan S, et al. Adv Sci (Weinh). 2019 Oct 14;6(23):1901152. doi: 10.1002/advs.201901152. eCollection 2019 Dec. Adv Sci (Weinh). 2019. PMID: 31832311 Free PMC article.
References
- Marshall CJ. Specificity of receptor tyrosine kinase signaling: Transient versus sustained extracellular signal-regulated kinase activation. Cell. 1995;80:179–185. - PubMed
- Chao MV. Growth factor signaling: where is the specificity? Cell. 1992;68:995–997. - PubMed
- Segal RA. Selectivity in neurotrophin signaling: theme and variations. Annu Rev Neurosci. 2003;26:299–330. - PubMed
Publication types
MeSH terms
Substances
LinkOut - more resources
Full Text Sources
Other Literature Sources


