Tumor transcriptome sequencing reveals allelic expression imbalances associated with copy number alterations - PubMed (original) (raw)
. 2010 Feb 19;5(2):e9317.
doi: 10.1371/journal.pone.0009317.
Rebecca R Laborde, Xing Xu, Jian Gu, Christina B Chung, Cinna K Monighetti, Sarah J Stanley, Kerry D Olsen, Jan L Kasperbauer, Eric J Moore, Adam J Broomer, Ruoying Tan, Pius M Brzoska, Matthew W Muller, Asim S Siddiqui, Yan W Asmann, Yongming Sun, Scott Kuersten, Melissa A Barker, Francisco M De La Vega, David I Smith
Affiliations
- PMID: 20174472
- PMCID: PMC2824832
- DOI: 10.1371/journal.pone.0009317
Tumor transcriptome sequencing reveals allelic expression imbalances associated with copy number alterations
Brian B Tuch et al. PLoS One. 2010.
Abstract
Due to growing throughput and shrinking cost, massively parallel sequencing is rapidly becoming an attractive alternative to microarrays for the genome-wide study of gene expression and copy number alterations in primary tumors. The sequencing of transcripts (RNA-Seq) should offer several advantages over microarray-based methods, including the ability to detect somatic mutations and accurately measure allele-specific expression. To investigate these advantages we have applied a novel, strand-specific RNA-Seq method to tumors and matched normal tissue from three patients with oral squamous cell carcinomas. Additionally, to better understand the genomic determinants of the gene expression changes observed, we have sequenced the tumor and normal genomes of one of these patients. We demonstrate here that our RNA-Seq method accurately measures allelic imbalance and that measurement on the genome-wide scale yields novel insights into cancer etiology. As expected, the set of genes differentially expressed in the tumors is enriched for cell adhesion and differentiation functions, but, unexpectedly, the set of allelically imbalanced genes is also enriched for these same cancer-related functions. By comparing the transcriptomic perturbations observed in one patient to his underlying normal and tumor genomes, we find that allelic imbalance in the tumor is associated with copy number mutations and that copy number mutations are, in turn, strongly associated with changes in transcript abundance. These results support a model in which allele-specific deletions and duplications drive allele-specific changes in gene expression in the developing tumor.
Conflict of interest statement
Competing Interests: Some of the authors of this manuscript are or have been employees of Life Technologies Inc., which manufactures the sequencing instrument and some materials used in this work. This does not alter the authors' adherence to the PLoS ONE policies on sharing of data and materials.
Figures
Figure 1. Alignment statistics for transcriptome reads from the six clinical samples.
Read counts listed in the middle section are expressed in millions (left column) or as a percentage of the total reads processed (right column) for each sample.
Figure 2. A common set of genes is differentially expressed in the tumors of three patients with oral carcinoma.
(A) Transcript expression levels in each of the six samples were hierarchically clustered and, as expected, the normal and tumor tissues form tight clusters. Shades of blue indicate lowered expression, relative to the mean across samples, whereas shades of yellow indicate higher expression relative to the mean. (B) For each patient, gene expression in the tumor was compared to that in matched normal tissue. Pearson correlations indicate strong and significant (P<10−16) similarity of differential transcript expression across the three patients. (C) A scatterplot, comparing differential transcript expression between patients 8 and 33.
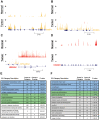
Figure 3. The genes commonly mis-regulated across the three cases of oral carcinoma function in cell differentiation, adhesion, extracellular matrix digestion and muscle contraction.
(A–D) Examples of gene expression at four loci. Plotted across each locus is the normalized sequence coverage on both the plus (colored red) and minus (colored orange) strands, for the tumor and normal tissue of a particular patient. (A) MMP1 in patient 51; y-axis scale is 10 to 2000. (B) INHBA in patient 8; y-axis scale is 10 to 150. (C) HMGA2 and RPSAS52 in patient 8; y-axis scale is 10 to 300 for the plus strand and 10 to 100 for the minus strand. (D) CASQ1 in patient 33; y-axis scale is 10 to 100. (E–F) The most up-regulated (E) and down-regulated (F) genes in the tumors of the three patients were submitted for gene ontology (GO) analysis to identify biological processes and components that are typically mis-regulated in oral cancer. Redundant GO categories were filtered. “Count in category” indicates the total number of genes assigned to a given GO category and “count in overlap” indicates the number of up- or down- regulated genes that are also assigned to the given GO category.
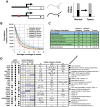
Figure 4. A common set of genes, functioning in cell adhesion and development, exhibits allelic imbalance in the tumor transcriptomes of three patients with oral carcinoma.
Allelic imbalance (AI) at the RNA level can arise in a number of ways, including through point mutation and changes in the relative expression of alleles (aka, allele-specific expression). (A) Illustrated is an example of two pre-existing alleles (G and T), one of which undergoes a linked promoter mutation (red asterisk) in the tumor, relative to the normal tissue. If, for example, the mutation alters a _cis_-regulatory element, then the balance of the two alelles (G and T) may change. (B) In principle, there is enough sequence coverage to discover AI for a large number of exons. For example, more than 25,000 exons have at least 10x coverage (averaged across all sites in the exon). (C) Genes with one or more instances of allelic imbalance in the tumors of two or more patients were submitted for GO analysis to identify biological processes and components that are typically allelically imbalanced in oral cancer. Redundant GO categories were filtered. (D) A selection of genes with allelic imbalance in two or more patients is listed, along with the log2 differential expression of each gene and regions of gene structure impacted. Also noted is whether or not the gene is involved in cell adhesion or is a component of the ECM. Key: 3 = 3′ UTR, I = Intronic, NSS = Near Splice Site, Syn = Synonymous, → = Non-Synonymous.
Figure 5. A switch in the genomic imprinting of H19 and IGF2.
There are six sites in H19 (shaded orange) and one in IGF2 (shaded blue) on chromosome 11 that are apparently heterozygous in patient 8 (five were validated by as-qPCR). In normal tissue, most detectable expression of H19 is from one allele, as expected for this imprinted, maternally expressed gene. Unexpectedly, in the tumor, nearly all detected expression is from the other, presumably paternal, allele. Observed nucleotides are from dbSNP.
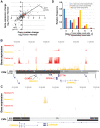
Figure 6. Large structural mutations are strongly correlated with the changes in gene expression observed in one patient's tumor.
(A) A strong correlation (ρ = 0.73) is observed between changes in copy number and changes in gene expression for patient 8. The correlation is stronger (ρ = 0.84) if only copy number changes greater than 1.4-fold are considered. (B) The most strongly amplified region (9-fold more copies in the tumor than normal; chr11:68,503,204-69,987,273) contains several differentially expressed (red and orange tracks) genes, highlighted in the text. (C) One region (chr9:21,973,361-22,061,522) that is likely to have been deleted in the tumor contains two genes of interest: cyclin-dependent kinase inhibitor 2B (CDKN2B) and cyclin-dependent kinase inhibitor 2A (CDKN2A). (D) Given that gene dosage changes are strongly associated with gene expression changes, it is expected that heterozygous amplifications and deletions will be associated with the allelic imbalance of transcripts. Shown are the distributions of allelic imbalance for genomic regions that fall into one of three categories of log-transformed copy number change (CNC): low or no CNC (blue; |CNC|<1.2), moderate CNC (red; 1.2<|CNC|<1.8), and large CNC (yellow; |CNC|>1.8). The moderate and large CNC distributions are shifted to significantly higher values of allelic imbalance compared to the no CNC distribution (Mann-Whitney P-values of 10−10 and 10−3, respectively).
Similar articles
- Landscape of somatic allelic imbalances and copy number alterations in human lung carcinoma.
Staaf J, Isaksson S, Karlsson A, Jönsson M, Johansson L, Jönsson P, Botling J, Micke P, Baldetorp B, Planck M. Staaf J, et al. Int J Cancer. 2013 May 1;132(9):2020-31. doi: 10.1002/ijc.27879. Epub 2012 Oct 20. Int J Cancer. 2013. PMID: 23023297 - Whole transcriptome sequencing identifies tumor-specific mutations in human oral squamous cell carcinoma.
Zhang Q, Zhang J, Jin H, Sheng S. Zhang Q, et al. BMC Med Genomics. 2013 Sep 4;6:28. doi: 10.1186/1755-8794-6-28. BMC Med Genomics. 2013. PMID: 24007313 Free PMC article. - Illumina whole-genome complementary DNA-mediated annealing, selection, extension and ligation platform: assessing its performance in formalin-fixed, paraffin-embedded samples and identifying invasion pattern-related genes in oral squamous cell carcinoma.
Loudig O, Brandwein-Gensler M, Kim RS, Lin J, Isayeva T, Liu C, Segall JE, Kenny PA, Prystowsky MB. Loudig O, et al. Hum Pathol. 2011 Dec;42(12):1911-22. doi: 10.1016/j.humpath.2011.02.011. Epub 2011 Jun 17. Hum Pathol. 2011. PMID: 21683979 - Integrative analysis of genome-wide loss of heterozygosity and monoallelic expression at nucleotide resolution reveals disrupted pathways in triple-negative breast cancer.
Ha G, Roth A, Lai D, Bashashati A, Ding J, Goya R, Giuliany R, Rosner J, Oloumi A, Shumansky K, Chin SF, Turashvili G, Hirst M, Caldas C, Marra MA, Aparicio S, Shah SP. Ha G, et al. Genome Res. 2012 Oct;22(10):1995-2007. doi: 10.1101/gr.137570.112. Epub 2012 May 25. Genome Res. 2012. PMID: 22637570 Free PMC article. - Diagnosis and therapy of oral squamous cell carcinoma.
Konkimalla VB, Suhas VL, Chandra NR, Gebhart E, Efferth T. Konkimalla VB, et al. Expert Rev Anticancer Ther. 2007 Mar;7(3):317-29. doi: 10.1586/14737140.7.3.317. Expert Rev Anticancer Ther. 2007. PMID: 17338652 Review.
Cited by
- Genomics, microRNA, epigenetics, and proteomics for future diagnosis, treatment and monitoring response in upper GI cancers.
Brücher BL, Li Y, Schnabel P, Daumer M, Wallace TJ, Kube R, Zilberstein B, Steele S, Voskuil JL, Jamall IS. Brücher BL, et al. Clin Transl Med. 2016 Mar;5(1):13. doi: 10.1186/s40169-016-0093-6. Epub 2016 Apr 6. Clin Transl Med. 2016. PMID: 27053248 Free PMC article. Review. - Cancer of the ampulla of Vater: analysis of the whole genome sequence exposes a potential therapeutic vulnerability.
Demeure MJ, Craig DW, Sinari S, Moses TM, Christoforides A, Dinh J, Izatt T, Aldrich J, Decker A, Baker A, Cherni I, Watanabe A, Koep L, Lake D, Hostetter G, Trent JM, Von Hoff DD, Carpten JD. Demeure MJ, et al. Genome Med. 2012 Jul 4;4(7):56. doi: 10.1186/gm357. eCollection 2012. Genome Med. 2012. PMID: 22762308 Free PMC article. - Gene2DGE: a Perl package for gene model renewal with digital gene expression data.
Tang X, Deng L, Zhang D, Lin J, Wei Y, Zhou Q, Li X, Li G, Liang S. Tang X, et al. Genomics Proteomics Bioinformatics. 2012 Feb;10(1):51-4. doi: 10.1016/S1672-0229(11)60033-8. Genomics Proteomics Bioinformatics. 2012. PMID: 22449401 Free PMC article. - Simul-seq: combined DNA and RNA sequencing for whole-genome and transcriptome profiling.
Reuter JA, Spacek DV, Pai RK, Snyder MP. Reuter JA, et al. Nat Methods. 2016 Nov;13(11):953-958. doi: 10.1038/nmeth.4028. Epub 2016 Oct 10. Nat Methods. 2016. PMID: 27723755 Free PMC article. - A Genome-Wide Study of Allele-Specific Expression in Colorectal Cancer.
Liu Z, Dong X, Li Y. Liu Z, et al. Front Genet. 2018 Nov 27;9:570. doi: 10.3389/fgene.2018.00570. eCollection 2018. Front Genet. 2018. PMID: 30538721 Free PMC article.
References
- Bentley DR. Whole-genome re-sequencing. Curr Opin Genet Dev. 2006;16:545–552. - PubMed
- Mortazavi A, Williams BA, McCue K, Schaeffer L, Wold B. Mapping and quantifying mammalian transcriptomes by RNA-Seq. Nat Methods. 2008;5:621–628. - PubMed
Publication types
MeSH terms
LinkOut - more resources
Full Text Sources
Other Literature Sources
Medical
Molecular Biology Databases
Research Materials


