Increased food intake leads to obesity and insulin resistance in the tg2576 Alzheimer's disease mouse model - PubMed (original) (raw)
Increased food intake leads to obesity and insulin resistance in the tg2576 Alzheimer's disease mouse model
Motoyuki Kohjima et al. Endocrinology. 2010 Apr.
Abstract
Recent studies suggest that hyperinsulinemia and insulin resistance are linked to Alzheimer's disease (AD). In this study, we used Tg2576 transgenic (Tg) mice, a widely used transgenic mouse model for AD, to explore the relationship between increased amyloid beta-peptide (Abeta) and insulin resistance. When fed a high-fat diet (HFD), Tg mice developed obesity and insulin resistance at 16 wk of age. Furthermore, HFD-fed Tg mice displayed abnormal feeding behavior and increased caloric intake with time. Although caloric intake of HFD-fed Tg mice was similar to that of normal diet-fed Tg or wild-type mice during 4 to 8 wk of age, it increased sharply at 12 wk, and went up further at 16 wk, which paralleled changes in the level of Abeta40 and Abeta42 in the brain of these mice. Limiting food intake in HFD-fed Tg mice by pair-feeding a caloric intake identical with that of normal diet-fed mice completely prevented the obesity and insulin intolerance of HFD-fed Tg mice. The hypothalamus of HFD-fed Tg mice had a significant decrease in the expression of the anorexigenic neuropeptide, brain-derived neurotrophic factor, at both the mRNA and protein levels. These findings suggest that the increased Abeta in the brain of HFD-fed Tg2576 mice is associated with reduced brain-derived neurotrophic factor expression, which led to abnormal feeding behavior and increased food intake, resulting in obesity and insulin resistance in these animals.
Figures
Figure 1
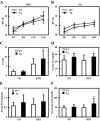
HFD feeding induces excess total body and fat mass in Tg2576 mice. A and B, Body weight of mice fed with HFD (A) and ND (B). Body weights were monitored every 4 wk (n = 14–27 of each group). C, Weight of fat mass at 16 wk of age (n = 14–27). D, Serum triglyceride at 16 wk of age (n = 17–20 of each group). E, Serum-free fatty acid at 16 wk of age (n = 17–20 of each group). F, Serum glycerol at 16 wk of age (n = 17–20 of each group). In all panels, data are expressed as means ±
sd
. *, P < 0.05 and **, P < 0.01 vs. WT group.
Figure 2
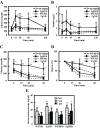
HFD-feeding induces insulin resistance in Tg2576 mice. A and B, Intraperitoneal glucose tolerance test at 16 wk of age (n = 3–5 of each group). Glucose response is shown in A. Insulin response is shown in B. C and D, Intraperitoneal insulin tolerance test at 16 wk of age (n = 3–5 of each group). Glucose response is shown in C. Change of glucose is shown in D. E, Serum corticosterone at 0700 h with overnight fasting, 0700 h, and 1900 h without fasting at 16 wk of age. In all panels, data are expressed as means ±
sd
. *, P < 0.05 and **, P < 0.01 vs. WT group.
Figure 3
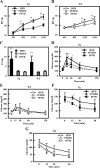
Food intake and feeding behavior. A, Caloric intake at 16 wk of age. Food intake was measured every day (n = 4–5 of each group). B, Circadian change of caloric intake at 16 wk of age (n = 6–10 of each group). Food intake was measured every 3 h. C and D, Food intake during daytime (C) and nighttime (D). E, Serum leptin at 16 wk of age (n = 17–20 of each group). F, Serum ghrelin at 16 wk of age (n = 4–7 of each group). G, Behavioral satiety sequence at 16 wk of age. Results are shown as the time of behavioral observations in 5-min time bins classified as either inactive, groom, active, or feed (n = 9–12 of each group). Total time of behavioral observations was shown in bottom panel. In all panels, data are expressed as means ±
sd
. *, P < 0.05 and **, P < 0.01 vs. WT group.
Figure 4
Time course of caloric intake, hyperinsulinemia, and Aβ content in the brain. A, Time course of caloric intake. Food intake was measured every day (n = 4–5 of each group). B, Time course of serum insulin (6 h fasting) (n = 11–12 of each group). C, Time course of Aβ40 extract in brain (n = 3–4 of each group). D, Time course of Aβ42 extract in brain (n = 3–4 of each group). In all panels, data are expressed as means ±
sd
. *, P < 0.05 and **, P < 0.01 vs. WT group; †, P < 0.05 and ††, P < 0.01 vs. ND group.
Figure 5
PF abolished the phenotype of Tg mice fed with HFD. A and B, Body weight of Tg (A) and WT mice (B) with PF. Body weights were monitored every 4 wk (n = 5 of each group). C, Weight of fat mass at 16 wk of age (n = 5 of each group). D and E, Intraperitoneal glucose tolerance test at 16 wk of age (n = 4 of each group). Glucose response for Tg mice is shown in D. Glucose response for WT mice is shown in E. F and G, Intraperitoneal insulin tolerance test at 16 wk of age (n = 4 of each group). Glucose response for Tg mice is shown in F. Glucose response for WT mice is shown in G. Data are expressed as means ±
sd
. *, P < 0.05 and **, P < 0.01 vs. PFHFD group; †, P < 0.05 and ††, P < 0.01 vs. PFND group.
Figure 6
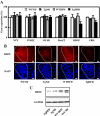
Hypothalamic neuropeptide expression. A, mRNA expression of neuropeptides that are involved in feeding behavior in hypothalamus at 16 wk of age. The relative expression of neuropeptides was expressed as the percentage of the ratio in WT mice fed with ND. Data are expressed as means ±
sem
. *, P < 0.05 vs. WT group. B, BDNF immunostaining (upper panel), and 4′,6-diamidino-2-phenylindole (DAPI, lower panel) for the paraventricular nucleus in the hypothalamus (highlighted by dotted lines) of 16-wk-old mice. Scale bar, 20 μm. C, Western blot for BDNF and GAPDH of hypothalamus from 16-wk-old mice.
Similar articles
- Circulating triglycerides after a high-fat meal: predictor of increased caloric intake, orexigenic peptide expression, and dietary obesity.
Karatayev O, Gaysinskaya V, Chang GQ, Leibowitz SF. Karatayev O, et al. Brain Res. 2009 Nov 17;1298:111-22. doi: 10.1016/j.brainres.2009.08.001. Epub 2009 Aug 8. Brain Res. 2009. PMID: 19666014 Free PMC article. - Transgenic mice overexpressing nesfatin/nucleobindin-2 are susceptible to high-fat diet-induced obesity.
Shimizu H, Tanaka M, Osaki A. Shimizu H, et al. Nutr Diabetes. 2016 Mar 7;6(3):e201. doi: 10.1038/nutd.2015.42. Nutr Diabetes. 2016. PMID: 26950482 Free PMC article. - Increased susceptibility to diet-induced obesity in histamine-deficient mice.
Jørgensen EA, Vogelsang TW, Knigge U, Watanabe T, Warberg J, Kjaer A. Jørgensen EA, et al. Neuroendocrinology. 2006;83(5-6):289-94. doi: 10.1159/000095339. Epub 2006 Aug 22. Neuroendocrinology. 2006. PMID: 16926531 - High-Fat Diets in Animal Models of Alzheimer's Disease: How Can Eating Too Much Fat Increase Alzheimer's Disease Risk?
Valentin-Escalera J, Leclerc M, Calon F. Valentin-Escalera J, et al. J Alzheimers Dis. 2024;97(3):977-1005. doi: 10.3233/JAD-230118. J Alzheimers Dis. 2024. PMID: 38217592 Free PMC article. Review. - Obesity and dietary fat influence dopamine neurotransmission: exploring the convergence of metabolic state, physiological stress, and inflammation on dopaminergic control of food intake.
Wallace CW, Fordahl SC. Wallace CW, et al. Nutr Res Rev. 2022 Dec;35(2):236-251. doi: 10.1017/S0954422421000196. Epub 2021 Jun 28. Nutr Res Rev. 2022. PMID: 34184629 Free PMC article. Review.
Cited by
- Amyloid precursor protein and proinflammatory changes are regulated in brain and adipose tissue in a murine model of high fat diet-induced obesity.
Puig KL, Floden AM, Adhikari R, Golovko MY, Combs CK. Puig KL, et al. PLoS One. 2012;7(1):e30378. doi: 10.1371/journal.pone.0030378. Epub 2012 Jan 19. PLoS One. 2012. PMID: 22276186 Free PMC article. - The lighter side of BDNF.
Noble EE, Billington CJ, Kotz CM, Wang C. Noble EE, et al. Am J Physiol Regul Integr Comp Physiol. 2011 May;300(5):R1053-69. doi: 10.1152/ajpregu.00776.2010. Epub 2011 Feb 23. Am J Physiol Regul Integr Comp Physiol. 2011. PMID: 21346243 Free PMC article. Review. - Endothelial-specific deficiency of megalin in the brain protects mice against high-fat diet challenge.
Bartolome F, Antequera D, de la Cueva M, Rubio-Fernandez M, Castro N, Pascual C, Camins A, Carro E. Bartolome F, et al. J Neuroinflammation. 2020 Jan 14;17(1):22. doi: 10.1186/s12974-020-1702-2. J Neuroinflammation. 2020. PMID: 31937343 Free PMC article. - Alterations in brain leptin signalling in spite of unchanged CSF leptin levels in Alzheimer's disease.
Maioli S, Lodeiro M, Merino-Serrais P, Falahati F, Khan W, Puerta E, Codita A, Rimondini R, Ramirez MJ, Simmons A, Gil-Bea F, Westman E, Cedazo-Minguez A; Alzheimer's Disease Neuroimaging Initiative. Maioli S, et al. Aging Cell. 2015 Feb;14(1):122-9. doi: 10.1111/acel.12281. Epub 2014 Dec 2. Aging Cell. 2015. PMID: 25453257 Free PMC article. - Obesity and sex interact in the regulation of Alzheimer's disease.
Moser VA, Pike CJ. Moser VA, et al. Neurosci Biobehav Rev. 2016 Aug;67:102-18. doi: 10.1016/j.neubiorev.2015.08.021. Epub 2015 Dec 18. Neurosci Biobehav Rev. 2016. PMID: 26708713 Free PMC article. Review.
References
- Leibson CL, Rocca WA, Hanson VA, Cha R, Kokmen E, O'Brien PC, Palumbo PJ 1997 Risk of dementia among persons with diabetes mellitus: a population-based cohort study. Am J Epidemiol 145:301–308 - PubMed
- Ott A, Stolk RP, van Harskamp F, Pols HA, Hofman A, Breteler MM 1999 Diabetes mellitus and the risk of dementia: The Rotterdam Study. Neurology 53:1937–1942 - PubMed
- Bertram L, Blacker D, Mullin K, Keeney D, Jones J, Basu S, Yhu S, McInnis MG, Go RC, Vekrellis K, Selkoe DJ, Saunders AJ, Tanzi RE 2000 Evidence for genetic linkage of Alzheimer’s disease to chromosome 10q. Science 290:2302–2303 - PubMed
- Selkoe DJ 2001 Clearing the brain’s amyloid cobwebs. Neuron 32:177–180 - PubMed
- Qiu WQ, Folstein MF 2006 Insulin, insulin-degrading enzyme and amyloid-β peptide in Alzheimer’s disease: review and hypothesis. Neurobiol Aging 27:190–198 - PubMed
Publication types
MeSH terms
Substances
LinkOut - more resources
Full Text Sources
Medical
Molecular Biology Databases
Miscellaneous


