Rapid model building of alpha-helices in electron-density maps - PubMed (original) (raw)
Rapid model building of alpha-helices in electron-density maps
Thomas C Terwilliger. Acta Crystallogr D Biol Crystallogr. 2010 Mar.
Abstract
A method for the identification of alpha-helices in electron-density maps at low resolution followed by interpretation at moderate to high resolution is presented. Rapid identification is achieved at low resolution, where alpha-helices appear as tubes of density. The positioning and direction of the alpha-helices is obtained at moderate to high resolution, where the positions of side chains can be seen. The method was tested on a set of 42 experimental electron-density maps at resolutions ranging from 1.5 to 3.8 A. An average of 63% of the alpha-helical residues in these proteins were built and an average of 76% of the residues built matched helical residues in the refined models of the proteins. The overall average r.m.s.d. between main-chain atoms in the modeled alpha-helices and the nearest atom with the same name in the refined models of the proteins was 1.3 A.
Figures
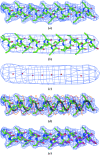
Figure 1
Model α-helix density and interpretation. (a) Model α-helix at a resolution of 3 Å. (b) Model α-helix at a resolution of 7 Å. (c) Points along the axis of a tube of density at a resolution of 7 Å. (d) Positioning an α-helix in model density. The dark blue mesh is a contour of model electron density at a resolution of 3 Å. The gray helix is fitted to the main-chain atoms of the model α-helix and has a radius of 2 Å and a pitch of 5.4 Å. The red and yellow helices are offset by ±1 Å along the helix axis from the gray main-chain helix and have radii of 4 Å. (e) Model α-helix (in green), model density (in blue) and fitted α-helix (in red). This figure was created using PyMOL (DeLano, 2002 ▶).
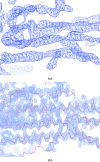
Figure 2
SAD-phased density-modified electron-density map of a calcium pump (Sorensen et al., 2004 ▶) recalculated using the PHENIX AutoSol wizard at a resolution of 3.1 Å. (a) Section of map truncated at a resolution of 7 Å. (b) The same section as in (a) but calculated at a resolution of 3.1 Å, showing the helices found with the present procedure in yellow and those from the refined structure (PDB entry
1t5s
; Sorensen et al., 2004 ▶) in red. This figure was created using Coot (Emsley & Cowtan, 2004 ▶)
Figure 3
Accuracy of α-helical models. The r.m.s.d. between the α-helical models obtained using the present method and the corresponding refined models from Table 1 ▶ is plotted. (a) R.m.s.d. as a function of map quality. (b) R.m.s.d. as a function of resolution. (c) R.m.s.d. as a function of map–helical model correlation.
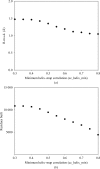
Figure 4
Accuracy and residues built versus cutoff for accepting helices. (a) The overall r.m.s.d. as in Fig. 3 ▶ is plotted as a function of the parameter cc_helix_min which defines the minimum correlation of density between a helix and the electron-density map. The default is 0.5. (b) The overall number of residues built for the 42 structures in Table 1 ▶ is plotted as a function of cc_helix_min.
Similar articles
- Rapid chain tracing of polypeptide backbones in electron-density maps.
Terwilliger TC. Terwilliger TC. Acta Crystallogr D Biol Crystallogr. 2010 Mar;66(Pt 3):285-94. doi: 10.1107/S0907444910000272. Epub 2010 Feb 12. Acta Crystallogr D Biol Crystallogr. 2010. PMID: 20179340 Free PMC article. - Rapid model building of beta-sheets in electron-density maps.
Terwilliger TC. Terwilliger TC. Acta Crystallogr D Biol Crystallogr. 2010 Mar;66(Pt 3):276-84. doi: 10.1107/S0907444910000302. Epub 2010 Feb 12. Acta Crystallogr D Biol Crystallogr. 2010. PMID: 20179339 Free PMC article. - Automatic α-helix identification in Patterson maps.
Caliandro R, Dibenedetto D, Cascarano GL, Mazzone A, Nico G. Caliandro R, et al. Acta Crystallogr D Biol Crystallogr. 2012 Jan;68(Pt 1):1-12. doi: 10.1107/S0907444911046282. Epub 2011 Dec 9. Acta Crystallogr D Biol Crystallogr. 2012. PMID: 22194328 - Improving macromolecular atomic models at moderate resolution by automated iterative model building, statistical density modification and refinement.
Terwilliger TC. Terwilliger TC. Acta Crystallogr D Biol Crystallogr. 2003 Jul;59(Pt 7):1174-82. doi: 10.1107/s0907444903009922. Epub 2003 Jun 27. Acta Crystallogr D Biol Crystallogr. 2003. PMID: 12832760 Free PMC article. - Applications of ACORN to data at 1.45 A resolution.
Rajakannan V, Yamane T, Shirai T, Kobayashi T, Ito S, Velmurugan D. Rajakannan V, et al. J Synchrotron Radiat. 2004 Jan 1;11(Pt 1):64-7. doi: 10.1107/s0909049503023537. Epub 2003 Nov 28. J Synchrotron Radiat. 2004. PMID: 14646136 Review.
Cited by
- Brickworx builds recurrent RNA and DNA structural motifs into medium- and low-resolution electron-density maps.
Chojnowski G, Waleń T, Piątkowski P, Potrzebowski W, Bujnicki JM. Chojnowski G, et al. Acta Crystallogr D Biol Crystallogr. 2015 Mar;71(Pt 3):697-705. doi: 10.1107/S1399004715000383. Epub 2015 Feb 26. Acta Crystallogr D Biol Crystallogr. 2015. PMID: 25760616 Free PMC article. - Structure of the transcription activator target Tra1 within the chromatin modifying complex SAGA.
Sharov G, Voltz K, Durand A, Kolesnikova O, Papai G, Myasnikov AG, Dejaegere A, Ben Shem A, Schultz P. Sharov G, et al. Nat Commun. 2017 Nov 16;8(1):1556. doi: 10.1038/s41467-017-01564-7. Nat Commun. 2017. PMID: 29146944 Free PMC article. - Cryo-EM map interpretation and protein model-building using iterative map segmentation.
Terwilliger TC, Adams PD, Afonine PV, Sobolev OV. Terwilliger TC, et al. Protein Sci. 2020 Jan;29(1):87-99. doi: 10.1002/pro.3740. Epub 2019 Oct 24. Protein Sci. 2020. PMID: 31599033 Free PMC article. - Map segmentation, automated model-building and their application to the Cryo-EM Model Challenge.
Terwilliger TC, Adams PD, Afonine PV, Sobolev OV. Terwilliger TC, et al. J Struct Biol. 2018 Nov;204(2):338-343. doi: 10.1016/j.jsb.2018.07.016. Epub 2018 Jul 29. J Struct Biol. 2018. PMID: 30063987 Free PMC article. - Rapid chain tracing of polypeptide backbones in electron-density maps.
Terwilliger TC. Terwilliger TC. Acta Crystallogr D Biol Crystallogr. 2010 Mar;66(Pt 3):285-94. doi: 10.1107/S0907444910000272. Epub 2010 Feb 12. Acta Crystallogr D Biol Crystallogr. 2010. PMID: 20179340 Free PMC article.
References
- Adams, P. D., Grosse-Kunstleve, R. W., Hung, L.-W., Ioerger, T. R., McCoy, A. J., Moriarty, N. W., Read, R. J., Sacchettini, J. C., Sauter, N. K. & Terwilliger, T. C. (2002). Acta Cryst. D58, 1948–1954. - PubMed
- Alphey, M. S., Leonard, G. A., Gourley, D. G., Tetaud, E., Fairlamb, A. H. & Hunter, W. N. (1999). J. Biol. Chem. 274, 25613–25622. - PubMed
- Bernstein, F. C., Koetzle, T. F., Williams, G. J. B., Meyer, E. F. Jr, Brice, M. D., Rodgers, J. R., Kennard, O., Shimanouchi, T. & Tasumi, M. (1977). J. Mol. Biol. 112, 535–542. - PubMed
Publication types
MeSH terms
Substances
LinkOut - more resources
Full Text Sources


