Small molecule activators of TRPML3 - PubMed (original) (raw)
Small molecule activators of TRPML3
Christian Grimm et al. Chem Biol. 2010.
Abstract
We conducted a high-throughput screen for small molecule activators of the TRPML3 ion channel, which, when mutated, causes deafness and pigmentation defects. Cheminformatics analyses of the 53 identified and confirmed compounds revealed nine different chemical scaffolds and 20 singletons. We found that agonists strongly potentiated TRPML3 activation with low extracytosolic [Na(+)]. This synergism revealed the existence of distinct and cooperative activation mechanisms and a wide dynamic range of TRPML3 activity. Testing compounds on TRPML3-expressing sensory hair cells revealed the absence of activator-responsive channels. Epidermal melanocytes showed only weak or no responses to the compounds. These results suggest that TRPML3 in native cells might be absent from the plasma membrane or that the protein is a subunit of heteromeric channels that are nonresponsive to the activators identified in this screen.
Copyright 2010 Elsevier Ltd. All rights reserved.
Figures
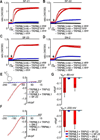
Figure 1. TRPML3-activating compounds
(A) Correlation plot for TRPML3 and TRPN1 high-throughput screens. Molecules found to be TRPML3 selective agonists are displayed as red triangles. Compound activity is normalized to the maximum carbachol response. Vertical and horizontal lines represent the hit cutoff values of the TRPML3 (11.46%) and TRPN1 (18.88%) screens. (B) [Ca2+]i increases of HEK293 cells transiently expressing human (h) TRPML3, or control TRP channels in response to application of 10 µM of selected compounds. TRPML1(NC) = TRPML1 variant that is localized to the plasma membrane (see Fig. 7A–C). For details and responses to compounds from all scaffold groups see Supplementary Figure S1. (C) Steady-state current-voltage plots of whole-cell currents elicited in HEK293 cells transiently transfected with human TRPML3 or YFP (negative control) after perfusion with compounds SF-11, SF-22, and SN-2 (10 µM in standard bath solution). For details and responses to compounds from all scaffold groups see Supplementary Figure S2. (D) Bar diagram shows average inward current densities at −80 mV of TRPML3 -expressing HEK293 cells before (no compound) and after compound application (+ compound). Cells transfected with the constitutively active human TRPML3(A419P) isoform (green) were used as positive, cells transfected with YFP were used as negative controls. In general, three bars are shown for each test series (no compound and with compound on TRPML3-expressing cells and with compound on YFP-expressing cells). For compounds SF-11, SF-22, and SN-2, we tested intracellular application (infusion), resulting in a fourth bar, shown and indicated in amber. Compound SF-11 elicited responses when applied intracellularly, which indicates that this molecule is either cell membrane permeant or that it is able to act on distinct intra- and extracellular activation sites. Compounds SF-22 and SN2 did not elicit a response when infused into the cells, indicating that the compounds act exclusively extracellularly, and suggesting that the compounds are not cell membrane permeable. The control compound probenicid did not activate TRPML3. Statistical comparisons of means were made using one-way ANOVA followed by Tukey's post test (mean values ± SEM, number in parentheses = number of cells analyzed), *** indicates p<0.0001, ** indicates p<0.001, * indicates p<0.01. (E) shows continuous sample traces demonstrating spontaneous TRPML3 single channel openings in an outside-out patch in the absence of the small molecule activator. “C” indicates the closed level of the traces. (F) shows a representative outside-out patch recording illustrating the effect of compounds SF-22 on the activity of TRPML3 expressed in HEK293 cells. The patches were held at −80 mV. The compound was applied, as indicated by the bar. The inset below the recording shows the expanded sample trace from the same patch obtained before the application of SF-22.
Figure 2. Effects of extracellular sodium on TRPML3
(A) Average steady-state current-voltage plots of whole-cell currents elicited in HEK293 cells expressing murine TRPML3 before and after perfusion with extracellular solution containing (in mM) 2 NaCl, 150 KCl, 0.25 CaCl2, 10 HEPES, and 10 d-glucose; pH 7.4 (endolymph-like solution = ELS). Standard bath solution (SBS) contained (in mM) 138 NaCl, 5.4 KCl, 2 MgCl2, 2 CaCl2, 10 HEPES, and 10 d-glucose; pH 7.4. The major cation in the pipette solution was 150mM Cs+ (pH 7.2). Currents elicited with extracellular ELS in non-transfected HEK293 cells (NT) are depicted in grey. (B) Average inward current densities of the experiments in (A) at −80 mV and −200 mV. (C) Average steady-state current-voltage plots of whole-cell currents in presence of extracellular solution containing either 150 mM KCl, LiCl, CsCl, or NMDG-Cl (0 Ca2+, 0 Mg2+, 0 Na+). The major cation in the pipette solution was 150 mM Cs+ (pH 7.2). (D) Average inward current densities of the experiments in C at −80mV and −200mV. (E) “Dose-response” curve obtained from currents measured as described in A in different sodium and potassium concentrations corresponding to mouse endolymph composition during neonatal inner ear maturation (in mM: SBS = 138 NaCl, 5.4 KCl, S1 = 40 NaCl, 110 KCl, S2 = 20 NaCl, 130 KCl, S3 = 5 NaCl, 145 KCl, S4 = 2 NaCl, 150 KCl). (F) Average inward current densities before and after perfusion with ELS at −80 mV and −200 mV. The major cation in the pipette solution was either K+ or Na+ (150 mM, pH 7.2), as indicated. Shown are mean values ± SEM, n=parenthesized. Statistical comparisons of means were made using one-way ANOVA followed by Tukey's post test, *** indicates p<0.0001, ** indicates p<0.001, * indicates p<0.01.
Figure 3. Low extracellular sodium potentiates agonist effects on TRPML3
(A) Representative steady-state current-voltage plots of whole-cell currents before and after perfusion with compound SF-24 alone (10 µM), compound SF-24 + ELS, and with ELS alone. (B) Average inward current densities at −80 mV of experiments as shown in A, normalized by cell capacitance (pF). Shown are mean values ± SEM, (n) = number of cells analyzed. (C,D) Same experiments as described in A and B with singleton compound SN-2 (10 µM), holding potential = +10 mV, voltage steps between −80 mV and + 80 mV.
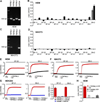
Figure 4. Compound effects on epidermal skin melanocytes
(A) RT-PCR shows robust expression of TRPML1 (500 bp), TRPML2 (411 bp), TRPML3 (487 bp), and GAPDH control (444 bp) in primary human epidermal melanocytes (HEM). (B) Ca2+-imaging results showing changes of [Ca2+]i in HEM in response to application of TRPML3-activating compounds at concentrations of 100µM (mean values ± SEM, n≥3 independent experiments with 20–30 cells). Responses to SN-2 are shown for 30µM (grey bar) and 100µM. (C) RT-PCR demonstrating presence of TRPML1 (470 bp) and GAPDH (442 bp) transcripts in NIH3T3 cells, but not TRPML2 (500 bp) and TRPML3 (550 bp). (D) Ca2+-imaging experiments as described in B showing compound effects (at 100 µM) on NIH3T3 cells. (E) Ca2+-imaging experiments showing [Ca2+]i increases in HEM transfected with human TRPML3-YFP or non-transfected cells (NT) upon application of SF-22 and SN-2 at 100 µM. (F) Ca2+-imaging experiments as described in E showing compound effects on NIH3T3 cells transfected with human TRPML3-YFP or NT. (G) Ca2+-imaging experiments on HEK293 cells expressing TRPML3 and dominant negative TRPML3(D458K) or TRPML2 as a control. Shown are responses to compounds SF-21 and SN-2. (H) SN-2-elicited changes of [Ca2+]i in HEM transfected with expression vectors for TRPML3, dominant negative TRPML3(D458K), and YFP control. NT = non-transfected control cells.
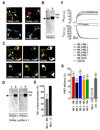
Figure 5. Interactions between different TRPML channels
(A) Confocal images of HEK293 cells expressing human TRPML3-YFP or -CFP as well as human TRPML1-YFP or–CFP. White arrows indicate plasma membrane and red arrows indicate intracellular protein aggregations. (B) Surface biotinylation experiment showing human TRPML3-YFP in the plasma membrane. L = input load (1% of total), E = elution from streptavidin beads. Surface-biotinylated YFP-tagged TRPML3 was visualized with anti-GFP antibody (Clontech, JL8). (C) Subcellular localization of human TRPML3-YFP when coexpressed 1:1 with human TRPML1-CFP in HEK293 cells and vice versa. (D) Biotinylation experiments showing human TRPML3-YFP (arrow) coexpressed with either human TRPML1 1:1 or empty vector control in HEK293 cells visualized with anti-GFP antibody in Western blot. (E) Relative surface biotinylation of TRPML3 coexpressed with TRPML1 in % (mean ± SEM, n=4). Cotransfections with empty vector were set to 100%. (F) Fluorescence energy resonance transfer (FRET) experiments showing average FRET efficiencies between TRPML homo- and heteromers. FRET efficiencies were determined by measuring the recovery of CFP fluorescence during YFP photobleaching. Cells were excited at 410 nm and 515 nm for CFP and YFP detection, respectively. YFP was bleached with an illumination at 512 nm for 2.2 seconds. (G) Average FRET efficiencies reported as mean values ± SEM, n=parenthesized. *** indicates p<0.0001, ** indicates p<0.001, Student’s _t_-test, unpaired, comparison with TRPC6/TRPML3 coexpression as negative control. All scale bars = 15 µm.
Figure 6. Coexpression of TRPML1 with TRPML3 decreases activation effect of TRPML3 agonists in transfected HEK293 cells
(A–D) Ca2+-imaging measurements of [Ca2+]i changes in HEK293 cells coexpressing TRPML3 with either TRPML1, TRPML2 (control), TRPV2 (control), or expression of TRPM1 alone in response to compounds SF-21, SF-22, SF-23, or SN-2 (10 µM). Shown are mean values ± SEM, n≥3 independent experiments with 20–30 cells each. (E–F) representative steady-state current-voltage plots of whole-cell currents. Currents were elicited in HEK293 cells coexpressing TRPML3-YFP with either TRPML1-HA or TRPV2-HA (control) before and after perfusion with selected compounds (10 µM in SBS). (G) Average inward current densities at −80 mV and −200 mV of experiments shown in E and F.
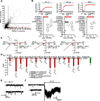
Figure 7. Effects of modulating TRPML1 expression and modulation of endocytosis on TRPML3 agonist responses
(A) Protein sequence comparison of the N- and C-termini of TRPML channels. Different lysosomal targeting sequence (LTS) motifs are labeled in green. (B) Simple drawing of the TRPML1 topology indicating the positions of the LTS motifs that were removed in mutant (-LTS) TRPML1 isoforms. (C) Representative laser scanning micrograph of HEK293 cells overexpressing TRPML1(NC)-YFP lacking N- and C-terminal LTS motifs. Please see Fig. 5A for comparison with wild type TRPML1 localization. The plasma membrane is visualized with pan-Cadherin (pan-Cad) antibodies (red). Scale bar = 10 µm. (D–F) Ca2+-imaging results showing relative [Ca2+]i increases after application of compound SF-23, SF-22, or SN-2 in HEK293 cells coexpressing TRPML3 with TRPML1, with TRPML1(NC) or with various controls. Shown are mean values ± SEM, n≥3 independent experiments with 20–30 cells each. (G) Confocal micrographs of HEK293 cells overexpressing wild type TRPML1-YFP or TRPML1-YFP mutant (C1218T, silent mutation disrupting the shRNA binding region) in presence or absence of TRPML1 shRNA (shRNA 1208). Only wild type TRPML1, but not the mutant is specifically downregulated by shRNA 1208. Scale bar = 50 µm. (H) Ca2+-imaging results showing [Ca2+]i increases in primary human epidermal melanocytes (HEM, black = non-transfected (NT)), and HEMs co-transfected with shRNA to TRPML1 (red) upon application of selected TRPML3 activating compounds from 5 different scaffolds (SF-11, -21, -22, -31, -41, -51) and singleton SN-2 at 30 µM (mean values ± SEM, n≥3 independent experiments with 5–10 cells). An expression vector for YFP was cotransfected with the shRNA for identification of the transfected cells. (I) Ca2+-imaging results showing changes in [Ca2+]i in HEMs transfected with either Dyn, DynK44A, or YFP (control) in response to application of TRPML3-activating compounds SF-11, SF-21, SF-51, and singleton SN-2 at a concentration of 30 µM, each (mean values ± SEM, n≥3 independent experiments with 20–30 cells).
Comment in
- Opening the TRPML gates.
Yamaguchi S, Muallem S. Yamaguchi S, et al. Chem Biol. 2010 Mar 26;17(3):209-10. doi: 10.1016/j.chembiol.2010.02.009. Chem Biol. 2010. PMID: 20338511 Free PMC article.
Similar articles
- Campaign to Identify Agonists of Transient Receptor Potential Channels 3 and 2 (TRPML3 & TRPML2).
Saldanha SA, Grimm C, Mercer BA, Choi JY, Allais C, Roush WR, Heller S, Hodder P. Saldanha SA, et al. 2009 Nov 13 [updated 2011 May 5]. In: Probe Reports from the NIH Molecular Libraries Program [Internet]. Bethesda (MD): National Center for Biotechnology Information (US); 2010–. 2009 Nov 13 [updated 2011 May 5]. In: Probe Reports from the NIH Molecular Libraries Program [Internet]. Bethesda (MD): National Center for Biotechnology Information (US); 2010–. PMID: 22049579 Free Books & Documents. Review. - Identification of Selective Agonists of the Transient Receptor Potential Channels 3 (TRPML3).
Saldanha SA, Grimm C, Allais C, Smith E, Ouizem S, Mercer BA, Roush WR, Heller S, Hodder P. Saldanha SA, et al. 2012 Mar 21 [updated 2013 Sep 3]. In: Probe Reports from the NIH Molecular Libraries Program [Internet]. Bethesda (MD): National Center for Biotechnology Information (US); 2010–. 2012 Mar 21 [updated 2013 Sep 3]. In: Probe Reports from the NIH Molecular Libraries Program [Internet]. Bethesda (MD): National Center for Biotechnology Information (US); 2010–. PMID: 24260779 Free Books & Documents. Review. - The Ca(2+) channel TRPML3 regulates membrane trafficking and autophagy.
Kim HJ, Soyombo AA, Tjon-Kon-Sang S, So I, Muallem S. Kim HJ, et al. Traffic. 2009 Aug;10(8):1157-67. doi: 10.1111/j.1600-0854.2009.00924.x. Epub 2009 May 11. Traffic. 2009. PMID: 19522758 Free PMC article. - Constitutive activity of TRPML2 and TRPML3 channels versus activation by low extracellular sodium and small molecules.
Grimm C, Jörs S, Guo Z, Obukhov AG, Heller S. Grimm C, et al. J Biol Chem. 2012 Jun 29;287(27):22701-8. doi: 10.1074/jbc.M112.368876. J Biol Chem. 2012. PMID: 22753890 Free PMC article. - Gain-of-function mutation in TRPML3 causes the mouse Varitint-Waddler phenotype.
Kim HJ, Li Q, Tjon-Kon-Sang S, So I, Kiselyov K, Muallem S. Kim HJ, et al. J Biol Chem. 2007 Dec 14;282(50):36138-42. doi: 10.1074/jbc.C700190200. Epub 2007 Oct 25. J Biol Chem. 2007. PMID: 17962195
Cited by
- Estradiol analogs attenuate autophagy, cell migration and invasion by direct and selective inhibition of TRPML1, independent of estrogen receptors.
Rühl P, Rosato AS, Urban N, Gerndt S, Tang R, Abrahamian C, Leser C, Sheng J, Jha A, Vollmer G, Schaefer M, Bracher F, Grimm C. Rühl P, et al. Sci Rep. 2021 Apr 15;11(1):8313. doi: 10.1038/s41598-021-87817-4. Sci Rep. 2021. PMID: 33859333 Free PMC article. - Lysosomal Calcium Channels in Autophagy and Cancer.
Wu Y, Huang P, Dong XP. Wu Y, et al. Cancers (Basel). 2021 Mar 15;13(6):1299. doi: 10.3390/cancers13061299. Cancers (Basel). 2021. PMID: 33803964 Free PMC article. Review. - Vascular mechanotransduction.
Davis MJ, Earley S, Li YS, Chien S. Davis MJ, et al. Physiol Rev. 2023 Apr 1;103(2):1247-1421. doi: 10.1152/physrev.00053.2021. Epub 2023 Jan 5. Physiol Rev. 2023. PMID: 36603156 Free PMC article. Review. - Transient receptor potential mucolipin 1 (TRPML1) and two-pore channels are functionally independent organellar ion channels.
Yamaguchi S, Jha A, Li Q, Soyombo AA, Dickinson GD, Churamani D, Brailoiu E, Patel S, Muallem S. Yamaguchi S, et al. J Biol Chem. 2011 Jul 1;286(26):22934-42. doi: 10.1074/jbc.M110.210930. Epub 2011 May 3. J Biol Chem. 2011. PMID: 21540176 Free PMC article. - Pathophysiological Role of Transient Receptor Potential Mucolipin Channel 1 in Calcium-Mediated Stress-Induced Neurodegenerative Diseases.
Santoni G, Maggi F, Amantini C, Marinelli O, Nabissi M, Morelli MB. Santoni G, et al. Front Physiol. 2020 Mar 24;11:251. doi: 10.3389/fphys.2020.00251. eCollection 2020. Front Physiol. 2020. PMID: 32265740 Free PMC article. Review.
References
- Atiba-Davies M, Noben-Trauth K. TRPML3 and hearing loss in the varitint-waddler mouse. Biochim Biophys Acta. 2007;1772:1028–1031. - PubMed
- Bargal R, Avidan N, Ben-Asher E, Olender Z, Zeigler M, Frumkin A, Raas-Rothschild A, Glusman G, Lancet D, Bach G. Identification of the gene causing mucolipidosis type IV. Nat Genet. 2000;26:118–123. - PubMed
- Cuajungco MP, Grimm C, Oshima K, D’Hoedt D, Nilius B, Mensenkamp AR, Bindels RJ, Plomann M, Heller S. PACSINs bind to the TRPV4 cation channel. PACSIN 3 modulates the subcellular localization of TRPV4. J Biol Chem. 2006;281:18753–18762. - PubMed
Publication types
MeSH terms
Substances
Grants and funding
- R01 DC004563-07A1/DC/NIDCD NIH HHS/United States
- P30 DC010363-017736/DC/NIDCD NIH HHS/United States
- U54 MH084512/MH/NIMH NIH HHS/United States
- U54 MH084512-010010/MH/NIMH NIH HHS/United States
- U54 MH084512-02/MH/NIMH NIH HHS/United States
- DC004563/DC/NIDCD NIH HHS/United States
- P30 DC010363-01/DC/NIDCD NIH HHS/United States
- MH083077/MH/NIMH NIH HHS/United States
- P30 DC010363/DC/NIDCD NIH HHS/United States
- U54MH084512/MH/NIMH NIH HHS/United States
- R03 MH083077/MH/NIMH NIH HHS/United States
- R03 MH083077-01/MH/NIMH NIH HHS/United States
- R01 DC004563/DC/NIDCD NIH HHS/United States
- U54 MH084512-020010/MH/NIMH NIH HHS/United States
- U54 MH084512-01/MH/NIMH NIH HHS/United States
- R01 DC004563-08/DC/NIDCD NIH HHS/United States
- P30 DC010363-017737/DC/NIDCD NIH HHS/United States
- R01 DC004563-09/DC/NIDCD NIH HHS/United States
- P30 DC010363-017735/DC/NIDCD NIH HHS/United States
LinkOut - more resources
Full Text Sources
Other Literature Sources
Molecular Biology Databases


