Global dynamics of proteins: bridging between structure and function - PubMed (original) (raw)
Review
Global dynamics of proteins: bridging between structure and function
Ivet Bahar et al. Annu Rev Biophys. 2010.
Abstract
Biomolecular systems possess unique, structure-encoded dynamic properties that underlie their biological functions. Recent studies indicate that these dynamic properties are determined to a large extent by the topology of native contacts. In recent years, elastic network models used in conjunction with normal mode analyses have proven to be useful for elucidating the collective dynamics intrinsically accessible under native state conditions, including in particular the global modes of motions that are robustly defined by the overall architecture. With increasing availability of structural data for well-studied proteins in different forms (liganded, complexed, or free), there is increasing evidence in support of the correspondence between functional changes in structures observed in experiments and the global motions predicted by these coarse-grained analyses. These observed correlations suggest that computational methods may be advantageously employed for assessing functional changes in structure and allosteric mechanisms intrinsically favored by the native fold.
Figures
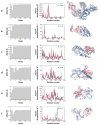
Figure 1
Correlation between collective motions predicted by the anisotropic network model (ANM) and experimentally observed structural changes. The bar plots in the left column illustrate the decrease in root-mean-square deviation (RMSD) between the two endpoints, which can be achieved by moving along particular ANM modes. The original RMSDs are reflected by the plateau values in each plot. There is usually a single or a few low-frequency modes that can be used to deform one of the conformations to get significantly closer to the other. The middle column compares the square displacements of residues calculated for this mode (red) to those experimentally observed between the two conformers (blue). Calculations were performed with Rc = 15 Å. Correlation coefficients between the theoretical and experimental curves appear in the upper-right corner of each graph. The right column shows one structure for each pair, as well as the largest components of the experimentally observed displacement vector (purple arrows) and the relevant ANM mode (green arrows). Panels refer to structural changes between (a) HIV-1 reverse transcriptase complexed with a non-nucleoside inhibitor (PDB code: 1vrt) and its unliganded (with K103N mutation) form (1hqe), using mode 2 of 1vrt; (b) actin in its free form (1j6z) and bound to DNase (1atn), using mode 1 of 1j6z; (c) two forms of a maltodextrin-binding protein (1anf and 1omp), using mode 2 of 1anf; (d) glutamine-binding protein in the unbound (1ggg) and glutamine-bound (1wdn) forms, using mode 4 of 1ggg; (e) LAO in the unbound (2lao) and lysine-bound (1lst) forms, using mode 1 of 2lao; and (f) LIR-1 in its unbound (1g0x) and HLA-A2-bound (1p7q) forms, using mode 3 of 1g0x.
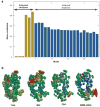
Figure 2
Analysis of X-ray crystallographic _B_-factors observed in experiments. (a) Decomposition of _B_-factors into external and internal contributions. The bars indicate the correlation between experimentally observed _B_-factors and external (translational, red; rotational; yellow) and internal [top-ranking 20 anisotropic network model (ANM) modes; _blue_] motions computed for a representative set of 90 high-resolution structures. By definition, no net contribution from rigid-body translation is detectable in this comparison because the corresponding eigenvectors are constants for all residues, whereas observed _B_-factors can be compared with, and appear to be affected by, rigid-body rotations. (b) Anisotropic displacements computed and observed for hen egg white lysozyme. Anisotropic _B_-factor data are displayed as color-coded (from red to blue, with decreasing size of fluctuations) ellipsoids for residues whose fluctuation volumes are at least one standard deviation away from mean values. The left three diagrams refer to experimental values reported in the PDB files 1iee, 4lzt, and 3lzt, and the right diagram to theoretical values predicted by ANM using the mean coordinates in 3lzt. 3lzt and 4lzt have the same crystal form; 1iee is different. Figure created using Rastep (53). For more details see Reference .
Figure 3
Two models of structural change observed upon ligand binding, induced fit versus selection of pre-existing conformer. In the elastic network model description of structural dynamics, pre-existing conformers are those readily accessible via movements along low-frequency modes. KNF, Koshland-Néméthy-Filmer; MWC, Monod-Wyman-Changeux.
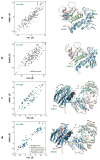
Figure 4
Comparison of principal changes in structure observed in experiments and predicted by the anisotropic network model (ANM). Results are displayed for calmodulin (CaM) complexed with myosin light chain kinase (MLCK) resolved by NMR in panels a and b and for p38 kinase in multiple forms in panels c and d. Both sets of experimental data (160 NMR models for CaM-MLCK, 74 PDB structures for p38) were subjected to principal component analysis (PCA) to obtain the two dominant changes in structures, PC1 and PC2, in each case. A representative structure [the apo structure (1p38) for p38 kinase, and the average model with the lowest root-mean-square deviation (RMSD) from all others in NMR ensemble for CaM-MLCK] from each set was analyzed by ANM to determine the global modes ANM1–ANM3. The plots on the left display the dispersion of the examined models/structures along these top-ranking mode axes derived from experiments (PC1–2) and theory (ANM1–3). Correlations in the range 0.77–0.95 are observed. The colored dots in the left plots of panels c and d refer to 4 unliganded (red), 56 inhibitor-bound (blue), 10 glucoside-bound (yellow), and 4 peptide-bound (purple) p38 structures; the gray dots in panels a and b refer to NMR models. The ribbon diagrams (right) illustrate the global movements predicted by theory (green arrows) and exhibited by experiments (mauve arrows). The MLCK is displayed in yellow in the ribbon diagrams, and a bound inhibitor is shown in space-filling representation in p38 kinase structures. See the text and Reference for more details.
Similar articles
- Structure-Encoded Global Motions and Their Role in Mediating Protein-Substrate Interactions.
Bahar I, Cheng MH, Lee JY, Kaya C, Zhang S. Bahar I, et al. Biophys J. 2015 Sep 15;109(6):1101-9. doi: 10.1016/j.bpj.2015.06.004. Epub 2015 Jul 2. Biophys J. 2015. PMID: 26143655 Free PMC article. Review. - Large-scale comparison of protein essential dynamics from molecular dynamics simulations and coarse-grained normal mode analyses.
Ahmed A, Villinger S, Gohlke H. Ahmed A, et al. Proteins. 2010 Dec;78(16):3341-52. doi: 10.1002/prot.22841. Proteins. 2010. PMID: 20848551 - Pre-existing soft modes of motion uniquely defined by native contact topology facilitate ligand binding to proteins.
Meireles L, Gur M, Bakan A, Bahar I. Meireles L, et al. Protein Sci. 2011 Oct;20(10):1645-58. doi: 10.1002/pro.711. Epub 2011 Sep 9. Protein Sci. 2011. PMID: 21826755 Free PMC article. Review. - Protein promiscuity: drug resistance and native functions--HIV-1 case.
Fernández A, Tawfik DS, Berkhout B, Sanders R, Kloczkowski A, Sen T, Jernigan B. Fernández A, et al. J Biomol Struct Dyn. 2005 Jun;22(6):615-24. doi: 10.1080/07391102.2005.10531228. J Biomol Struct Dyn. 2005. PMID: 15842167 - Coevolution of function and the folding landscape: correlation with density of native contacts.
Hills RD Jr, Brooks CL 3rd. Hills RD Jr, et al. Biophys J. 2008 Nov 1;95(9):L57-9. doi: 10.1529/biophysj.108.143388. Epub 2008 Aug 15. Biophys J. 2008. PMID: 18708465 Free PMC article.
Cited by
- Possible origin of life between mica sheets: does life imitate mica?
Hansma HG. Hansma HG. J Biomol Struct Dyn. 2013;31(8):888-95. doi: 10.1080/07391102.2012.718528. Epub 2012 Sep 11. J Biomol Struct Dyn. 2013. PMID: 22963072 Free PMC article. - Protein dynamics governed by interfaces of high polarity and low packing density.
Angarica VE, Sancho J. Angarica VE, et al. PLoS One. 2012;7(10):e48212. doi: 10.1371/journal.pone.0048212. Epub 2012 Oct 26. PLoS One. 2012. PMID: 23110216 Free PMC article. - Communication over the network of binary switches regulates the activation of A2A adenosine receptor.
Lee Y, Choi S, Hyeon C. Lee Y, et al. PLoS Comput Biol. 2015 Feb 9;11(2):e1004044. doi: 10.1371/journal.pcbi.1004044. eCollection 2015 Feb. PLoS Comput Biol. 2015. PMID: 25664580 Free PMC article. - Probing molecular mechanisms of the Hsp90 chaperone: biophysical modeling identifies key regulators of functional dynamics.
Dixit A, Verkhivker GM. Dixit A, et al. PLoS One. 2012;7(5):e37605. doi: 10.1371/journal.pone.0037605. Epub 2012 May 18. PLoS One. 2012. PMID: 22624053 Free PMC article. - Coupling Protein Dynamics with Proton Transport in Human Carbonic Anhydrase II.
Taraphder S, Maupin CM, Swanson JM, Voth GA. Taraphder S, et al. J Phys Chem B. 2016 Aug 25;120(33):8389-404. doi: 10.1021/acs.jpcb.6b02166. Epub 2016 Apr 20. J Phys Chem B. 2016. PMID: 27063577 Free PMC article.
References
- Bahar I, Atilgan AR, Demirel MC, Erman B. Vibrational dynamics of folded proteins: significance of slow and fast motions in relation to function and stability. Phys Rev Lett. 1998;80:2733–36.
- Bahar I, Atilgan AR, Erman B. Direct evaluation of thermal fluctuations in proteins using a single-parameter harmonic potential. Fold Des. 1997;2:173–81. - PubMed
Publication types
MeSH terms
Substances
Grants and funding
- R01 GM086238-03/GM/NIGMS NIH HHS/United States
- R01 GM086238/GM/NIGMS NIH HHS/United States
- R01 LM007994-07/LM/NLM NIH HHS/United States
- 1R01GM086238-01/GM/NIGMS NIH HHS/United States
- R01 LM007994/LM/NLM NIH HHS/United States
LinkOut - more resources
Full Text Sources
Other Literature Sources


