B cells are required for optimal CD4+ and CD8+ T cell tumor immunity: therapeutic B cell depletion enhances B16 melanoma growth in mice - PubMed (original) (raw)
B cells are required for optimal CD4+ and CD8+ T cell tumor immunity: therapeutic B cell depletion enhances B16 melanoma growth in mice
David J DiLillo et al. J Immunol. 2010.
Abstract
B lymphocytes can both positively and negatively regulate cellular immune responses. Previous studies have demonstrated augmented T cell-mediated tumor immunity in genetically B cell-deficient mice, suggesting that therapeutic B cell depletion would enhance tumor immunity. To test this hypothesis and quantify B cell contributions to T cell-mediated anti-tumor immune responses, mature B cells were depleted from wild-type adult mice using CD20 mAb prior to syngeneic B16 melanoma tumor transfers. Remarkably, s.c. tumor volume and lung metastasis were increased 2-fold in B cell-depleted mice. Effector-memory and IFN-gamma-or TNF-alpha-secreting CD4(+) and CD8(+) T cell induction was significantly impaired in B cell-depleted mice with tumors. Tumor Ag-specific CD8(+) T cell proliferation was also impaired in tumor-bearing mice that lacked B cells. Thus, B cells were required for optimal T cell activation and cellular immunity in this in vivo nonlymphoid tumor model. Although B cells may not have direct effector roles in tumor immunity, impaired T cell activation, and enhanced tumor growth in the absence of B cells argue against previous proposals to augment tumor immunity through B cell depletion. Rather, targeting tumor Ags to B cells in addition to dendritic cells is likely to optimize tumor-directed vaccines and immunotherapies.
Figures
FIGURE 1
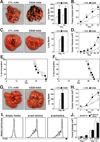
B cells enhance tumor immunity to B16 melanoma. (A, C, G) B cell depletion enhances B16 melanoma metastasis. Mice were given CD20 or control (CTL) mAb 7 d before i.v. transfer of (A) 3 × 10⁵ B16/F10, (C) 5 × 10⁴ B16/F10, or (G) 3 × 10⁵ B16/F0/OVA cells. Representative lungs from control mAb- and CD20 mAb-treated mice 14 d (B16/F10 high dose), 14 d (B16/F10 low dose), or 28 d (B16/F0/OVA) after tumor transfer are shown. Histograms represent mean (± SEM) numbers of visible pigmented tumor foci on the surface of lungs on the indicated days after transfer (n≥5 mice for each group). (B, D, H) B cell depletion enhances B16 melanoma growth. Mice were given CD20 or control mAb 7 d before s.c. transfer of (B) 1.5 × 10⁶ B16/F10, (D) 1 × 10⁵ B16/F10, or (H) 1.5 × 10⁶ B16/F0/OVA cells. Values represent mean tumor volumes (± SEM) at the site of transfer on the indicated days (n≥10 for each group). (E-F) Mouse survival following the i.v. transfer of (E) 4 × 10⁴ or (F) 3 × 10⁵ B16/F10 cells on day 0. All mice were given either control (open circles) or CD20 (closed circles) mAb on day −7 (n≥6 mice for each group). (I) B16/F10/mOVA cells activate OVA peptide-specific CD8+ T cells. Mice were given 3 × 10⁵ i.v. B16/F10 cells transfected with an empty vector (Empty Vector, n=1), B16/F10 cells transfected to express OVA (B16/F10/mOVA, n=3), or B16/F0/OVA (n=3) cells 1 d before CFSE-labeled Thy1.1+ CD8+ T cells from OT-I mice were transferred into each mouse. Lung-draining hilar lymph node lymphocytes were isolated 5 d later, with CFSE expression and dilution by CD8+Thy1.1+ T cells assessed by flow cytometry. Representative histograms showing CFSE intensity of CD8+Thy1.1+ cells are shown. (J) B16/F10 and B16/F10/mOVA have similar growth characteristics. Mice were given CD20 or control mAb 7 d before s.c. transfer of 1.5 × 10⁶ B16/F10 or B16/F10/mOVA cells. Values represent mean tumor volumes (± SEM) at the site of transfer on the indicated days (n≥10 for each group). Significant differences between means for the same days are indicated: *, p<0.05; **, p<0.01.
FIGURE 2
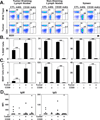
B cell depletion is effective in mice given B16 melanoma. (A) Representative B cell depletion in mice given CD20 or control (CTL) mAb 7 d before s.c. transfer of 1.5 × 10⁶ B16/F0/OVA cells. Fourteen days after tumor transfers, tumor-draining lymph node (left panels), non-draining lymph node (middle panels), and spleen (right panels) lymphocytes were isolated and assessed for B220 and CD4 expression by immunofluorescence staining with flow cytometry analysis. B220+ cell percentages within the indicated gates are shown for representative naïve (top panels) or tumor-bearing (bottom panels) mice. (B-C) Mean (± SEM) B220+ B cell (B) percentages and (C) total numbers in the tissues of control and tumor-bearing mice shown in (A) (n=3 for each group). (D) Ab responses to B16/F0/OVA cells are poor. B cells were depleted from mice as in (A), with serum collected from control or CD20 mAb-treated mice 14 d after tumor transfer. B16/F0/OVA cells were incubated with diluted serum, washed, and incubated with labeled anti-mouse IgM and IgG Abs before flow cytometry analysis. Circles represent the mean fluorescence intensity (MFI) of stained cells from individual mice that were treated as indicated. (B–D) Significant differences between means are indicated: *, p<0.05; **, p<0.01.
FIGURE 3
B cell depletion reduces spleen CD4+ T cell numbers. Changes in (A) spleen or (B) peripheral lymph node CD4+ and CD8+ T cell numbers following B cell depletion. Circles represent individual mice that were given control (open) or CD20 (closed) mAb, with spleen and peripheral lymph node (pooled axial, inguinal, and brachial nodes) lymphocytes harvested 21 (experiment 1) or 28 (experiments 2–3) d later. Bar graphs indicate means (± SEM) of pooled CD4+ and CD8+ T cell numbers from all three experiments. Significant differences between means are indicated: *, p<0.05.
FIGURE 4
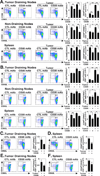
Effector-memory T cell induction is impaired in B cell-depleted tumor-bearing mice. Mice were given CD20 or control (CTL) mAb 7 d before half the mice in each group received 1.5 × 10⁶ s.c. B16/F0/OVA cells. Fourteen days later, the frequencies and numbers of (A) CD44hiCD62Llo CD4+ and (B) CD44hiCD62Llo CD8+ T cells within draining lymph nodes, non-draining lymph nodes, and spleens were determined by immunofluorescence staining with flow cytometry analysis (n=9 for each group, pooled from three separate experiments in which n=3). C-F) Mice, treated as in (A–B), received 1 × 10⁵ B16/F0/OVA cells, with (C–D) CD44hiCD62Llo CD4+ and (E–F) CD44hiCD62Llo CD8+ T cell frequencies and numbers analyzed for tumor draining lymph nodes and the spleen (n=5 per group). Representative dot plots gated on CD44hiCD62Llo T cells are shown, with relative percentages indicated. Bar graphs indicate the mean (± SEM) percentages and numbers of CD44hiCD62Llo cells in the indicated treatment groups. Significant differences between sample means are indicated: *, p<0.05; **, p<0.01.
FIGURE 5
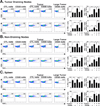
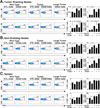
B cell depletion impairs the induction of IFNγ- and TNFα-secreting CD4+ cells in tumor-bearing mice. Mice were given CD20 or control (CTL) mAb 7 d before half the mice in each group received 1.5 × 10⁶ s.c. B16/F0/OVA cells. Fourteen days later, draining and non-draining lymph nodes and spleens were isolated, and B cells were removed using CD19 mAb-coated magnetic beads. The remaining non-B cells were cultured for 3.5 h with plate-bound CD3/CD28 mAbs before cell surface CD4 labeling and intracellular cytokine staining with flow cytometry analysis. Representative dot plots are shown for (A) tumor draining lymph nodes, (B) non-tumor draining lymph nodes, and (C) spleen CD4+ T cell expression of cytoplasmic IFNγ (upper panels) or TNFα (lower panels). Bar graphs indicate mean (± SEM) frequencies (left histograms) and numbers (right histograms) of CD4+IFNγ+ (upper panels) and CD4+TNFα+ (lower panels) cells in the indicated tissues of mice (n=6 for tumor-free control mice, n=6 for tumor-free CD20 mAb-treated mice, n=11 for tumor-treated control mice, and n=5 for CD20 mAb-treated mice with <0.25 cm3 tumors). Results from mice with tumors ≥0.25 cm3 (++) are also indicated (n=7). Significant differences between sample means are indicated: *, p<0.05; **, p<0.01.
FIGURE 6
B cell depletion impairs the induction of IFNγ- and TNFα-secreting CD8+ cells in tumor-bearing mice. Mice were treated as outlined in figure 5, except T cells expressing cell surface CD8 from (A) tumor draining lymph nodes, (B) non-draining lymph nodes, and (C) spleen were analyzed for cytoplasmic IFNγ (upper panels) or TNFα (lower panels) expression. Data presented are as outlined in figure 5.
FIGURE 7
B cells are required for optimal T cell cytokine induction in vitro. Purified splenic B cells (>99% CD19+) and total splenocytes depleted of CD19+ cells (T cells, <2% CD19+) from naïve wild type mice were cultured for 3.5 h in media alone (open diamonds) or with plate-bound CD3/CD28 mAbs (filled circles) at varying T:B cell ratios (106 total lymphocytes per well) before staining for cell surface CD4 or CD8 and cytoplasmic cytokine expression with flow cytometry analysis. Representative flow cytometry analysis (left panels) of CD4+ T cells expressing cytoplasmic (A) IFNγ or (B) TNFα, or CD8+ T cells expressing (C) IFNγ or (D) TNFα are shown for various culture conditions. Line graphs indicate mean (± SEM) results from triplicate culture wells, and are representative of the results obtained in two independent experiments. Significant differences between sample means are indicated: *, p<0.05; **, p<0.01.
FIGURE 8
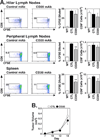
B cell depletion impairs tumor Ag-specific CD8+ T cell proliferation, but does not affect the growth of pre-established tumors. (A) Mice were given CD20 or control (CTL) mAb 6 d before receiving B16/F0/OVA cells i.v. One day later, the mice were adoptively-transferred with CFSE-labeled enriched Thy1.1+ CD8+ T cells from OT-I mice. Lymphocytes from lung-draining hilar lymph nodes, peripheral lymph nodes, and spleens were isolated 5 or 9 d after OT-I cell transfer in two separate experiments, with CD8 expression and CFSE dilution for Thy1.1+ T cells assessed by flow cytometry analysis. The results from the 5 and 9 day studies were similar, if not identical, so the data were pooled. Representative CFSE versus cell surface CD8 staining for Thy1.1+ cells is shown, with the percentages of CFSE-diluted CD8+ cells within each gate indicated as a fraction of total CD8+ Thy1.1+ T cells. Bar graphs show the mean percentage (± SEM) of CFSE-diluted cells from tumor-free wild type mice (open bars, n=3), tumor-bearing control mAb-treated mice (closed bars, n=6), and tumor-bearing CD20 mAb-treated mice (shaded bars, n=6). The far right bar graphs show total numbers of CD8+ T cells within each tissue. Significant differences between sample means are indicated: *, p<0.05; **, p<0.01. (B) Mice were given CD20 or control mAb 7 d after s.c. transfer of 105 B16/F10 cells, with tumor volumes measured on the indicated days.
Similar articles
- Dendritic cells charged with apoptotic tumor cells induce long-lived protective CD4+ and CD8+ T cell immunity against B16 melanoma.
Goldszmid RS, Idoyaga J, Bravo AI, Steinman R, Mordoh J, Wainstok R. Goldszmid RS, et al. J Immunol. 2003 Dec 1;171(11):5940-7. doi: 10.4049/jimmunol.171.11.5940. J Immunol. 2003. PMID: 14634105 - Stimulation of the glucocorticoid-induced TNF receptor family-related receptor on CD8 T cells induces protective and high-avidity T cell responses to tumor-specific antigens.
Côté AL, Zhang P, O'Sullivan JA, Jacobs VL, Clemis CR, Sakaguchi S, Guevara-Patiño JA, Turk MJ. Côté AL, et al. J Immunol. 2011 Jan 1;186(1):275-83. doi: 10.4049/jimmunol.1001308. Epub 2010 Nov 24. J Immunol. 2011. PMID: 21106849 Free PMC article. - Effector and regulatory B cells: modulators of CD4+ T cell immunity.
Lund FE, Randall TD. Lund FE, et al. Nat Rev Immunol. 2010 Apr;10(4):236-47. doi: 10.1038/nri2729. Epub 2010 Mar 12. Nat Rev Immunol. 2010. PMID: 20224569 Free PMC article. Review. - Lymphocyte-based model systems for allergy research: a historic overview.
Neunkirchner A, Schmetterer KG, Pickl WF. Neunkirchner A, et al. Int Arch Allergy Immunol. 2014;163(4):259-91. doi: 10.1159/000360163. Epub 2014 Apr 23. Int Arch Allergy Immunol. 2014. PMID: 24777172 Free PMC article. Review.
Cited by
- Impact of CD68/(CD3+CD20) ratio at the invasive front of primary tumors on distant metastasis development in breast cancer.
Eiró N, Pidal I, Fernandez-Garcia B, Junquera S, Lamelas ML, del Casar JM, González LO, López-Muñiz A, Vizoso FJ. Eiró N, et al. PLoS One. 2012;7(12):e52796. doi: 10.1371/journal.pone.0052796. Epub 2012 Dec 26. PLoS One. 2012. PMID: 23300781 Free PMC article. - The role of B cells in cancer development.
Tan R, Nie M, Long W. Tan R, et al. Front Oncol. 2022 Aug 11;12:958756. doi: 10.3389/fonc.2022.958756. eCollection 2022. Front Oncol. 2022. PMID: 36033455 Free PMC article. Review. - Impact of spatial metabolomics on immune-microenvironment in oral cancer prognosis: a clinical report.
Bag S, Oetjen J, Shaikh S, Chaudhary A, Arun P, Mukherjee G. Bag S, et al. Mol Cell Biochem. 2024 Jan;479(1):41-49. doi: 10.1007/s11010-023-04713-3. Epub 2023 Mar 26. Mol Cell Biochem. 2024. PMID: 36966422 - Atypical Memory and Regulatory B Cell Subsets in Tumor Draining Lymph Nodes of Head and Neck Squamous Cell Carcinoma Correlate with Good Prognostic Factors.
Norouzian M, Mehdipour F, Balouchi Anaraki S, Ashraf MJ, Khademi B, Ghaderi A. Norouzian M, et al. Head Neck Pathol. 2020 Sep;14(3):645-656. doi: 10.1007/s12105-019-01095-1. Epub 2019 Nov 5. Head Neck Pathol. 2020. PMID: 31691165 Free PMC article. - B Cells Are Required to Generate Optimal Anti-Melanoma Immunity in Response to Checkpoint Blockade.
Singh S, Roszik J, Saini N, Singh VK, Bavisi K, Wang Z, Vien LT, Yang Z, Kundu S, Davis RE, Bover L, Diab A, Neelapu SS, Overwijk WW, Rai K, Singh M. Singh S, et al. Front Immunol. 2022 May 26;13:794684. doi: 10.3389/fimmu.2022.794684. eCollection 2022. Front Immunol. 2022. PMID: 35720386 Free PMC article.
References
- Crawford A, Macleod M, Schumacher T, Corlett L, Gray D. Primary T cell expansion and differentiation in vivo requires antigen presentation by B cells. J. Immunol. 2006;176:3498–3506. - PubMed
- DiLillo DJ, Matsushita T, Tedder TF. B10 cells and regulatory B cells balance immune responses during inflammation, autoimmunity, and cancer. Ann. N. Y. Acad. Sci. 2010;1183:38–57. - PubMed
- Yanaba K, Bouaziz J-D, Haas KM, Poe JC, Fujimoto M, Tedder TF. A regulatory B cell subset with a unique CD1dhiCD5+ phenotype controls T cell-dependent inflammatory responses. Immunity. 2008;28:639–650. - PubMed
Publication types
MeSH terms
Grants and funding
- AI56363/AI/NIAID NIH HHS/United States
- U19 AI056363/AI/NIAID NIH HHS/United States
- CA96547/CA/NCI NIH HHS/United States
- CA105001/CA/NCI NIH HHS/United States
- R01 CA096547/CA/NCI NIH HHS/United States
- R01 CA105001/CA/NCI NIH HHS/United States
LinkOut - more resources
Full Text Sources
Other Literature Sources
Research Materials
