Ebola virus uses clathrin-mediated endocytosis as an entry pathway - PubMed (original) (raw)
Ebola virus uses clathrin-mediated endocytosis as an entry pathway
Suchita Bhattacharyya et al. Virology. 2010.
Abstract
Ebola virus (EBOV) infects several cell types and while viral entry is known to be pH-dependent, the exact entry pathway(s) remains unknown. To gain insights into EBOV entry, the role of several inhibitors of clathrin-mediated endocytosis in blocking infection mediated by HIV pseudotyped with the EBOV envelope glycoprotein (EbGP) was examined. Wild type HIV and envelope-minus HIV pseudotyped with Vesicular Stomatitis Virus glycoprotein (VSVg) were used as controls to assess cell viability after inhibiting clathrin pathway. Inhibition of clathrin pathway using dominant-negative Eps15, siRNA-mediated knockdown of clathrin heavy chain, chlorpromazine and sucrose blocked EbGP pseudotyped HIV infection. Also, both chlorpromazine and Bafilomycin A1 inhibited entry of infectious EBOV. Sensitivity of EbGP pseudotyped HIV as well as infectious EBOV to inhibitors of clathrin suggests that EBOV uses clathrin-mediated endocytosis as an entry pathway. Furthermore, since chlorpromazine inhibits EBOV infection, novel therapeutic modalities could be designed based on this lead compound.
Figures
Fig. 1
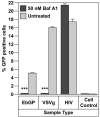
Importance of acidification on Ebola entry. Infectivity of EbGP, VSVg pseudotyped virus and HIV on HOS cells in the presence or absence of 50 nM Bafilomycin A1 (Baf A1). Error bars represent SEM for three independent infection samples. * p value for EbGP = 0.0003 (extremely significant) and p value for VSVg = 0.0003 (extremely significant).
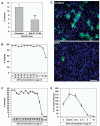
Fig. 2
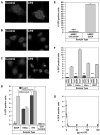
Chlorpromazine (CPZ) strongly inhibits EbGP mediated viral infection. (A) Transfection of HOS cells with eGFP-clathrin followed by treatment with 10 μg/ml chlorpromazine for 45 min. Left panel shows an untreated cell while the right panel shows a chlorpromazine treated cell. Scale bars represent 15 μm. (B) Treatment of HOS cells with 10 μg/ml chlorpromazine for 2 h followed by incubation with 14 μg/ml of TR-transferrin for 5 min. Image on the left represents untreated cells, while the image on the right depicts chlorpromazine treated cells. Scale bars represent 15 μm. (C) Treatment of HOS cells with 10 μg/ml chlorpromazine for 45 min followed by fixing and staining for transferrin receptor using mouse monoclonal antibody against human transferrin receptor and Cy3-conjugated anti-mouse secondary antibody. Image on the left represents untreated cells, while the image on the right depicts chlorpromazine treated cells. Scale bars represent 30 μm. (D) Infectivity of EbGP, VSVg pseudotyped virus and HIV on HOS cells was measured in the presence or absence of 10 μg/ml chlorpromazine. Error bars represent SEM for three independent infection samples. * p value = 0.0449 (significant). (E) Infectivity of EbGP pseudotyped virus on HMEC cells was measured in the presence or absence of 10 μg/ml chlorpromazine. Error bars represent SEM for three independent infection samples. * p value = 0.0009 (extremely significant). (F) Comparison of infectivity of EbGP pseudotyped virus in HOS, HeLa, Vero and 293T cells measured in the presence or absence of 10 μg/ml chlorpromazine. Error bars represent SEM for three independent infection samples. * p value for HOS = 0.0071 (very significant), p value for HeLa = 0.0017 (very significant), p value for Vero = 0.0037 (very significant) and p value for 293T = 0.0001 (extremely significant). (G) XY plot depicting dose response effect of chlorpromazine treatment on EbGP mediated infectivity in HOS cells. # represents complete cytotoxicity meaning no cells were left on the plate.
Fig. 3
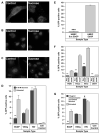
EbGP mediated viral infection is inhibited by sucrose. (A) Transient transfection of HOS cells with eGFP-clathrin followed by treatment with 0.45 M sucrose for 10 min. Left panel shows an untreated cell while the right panel shows sucrose treated cells. Scale bars represent 15 μm. (B) Treatment of HOS cells with 0.45 M sucrose for 45 min followed by incubation with 14 μg/ml of TR-transferrin for 5 min. Image on the left represents untreated cells, while the image on the right shows sucrose treated cells. Scale bars represent 15 μm. (C) Treatment of HOS cells with 0.45 M sucrose for 10 min followed by fixing and staining for transferrin receptor using mouse monoclonal antibody against human transferrin receptor and Cy3-conjugated anti-mouse secondary antibody. Image on the left represents untreated cells, while the image on the right depicts sucrose treated cells. Scale bars represent 30 μm. (D) Infectivity of EbGP, VSVg pseudotyped virus and HIV on HOS cells was measured in the presence or absence of 0.45 M sucrose. Error bars represent SEM for three independent infection samples. * p value = 0.0047 (very significant). (E) Infectivity of EbGP pseudotyped virus on HMEC cells measured in the presence or absence of 0.45 M sucrose. Error bars represent SEM for three independent infection samples. * p value = 0.0001 (extremely significant). (F) Comparison of infectivity of EbGP pseudotyped virus on HOS, HeLa, Vero and 293T cells measured in the presence or absence of 0.45 M sucrose. Error bars represent SEM for three independent infection samples. * p value for HOS = 0.0091 (very significant), p value for HeLa = 0.0018 (very significant), p value for Vero = 0.0014 (very significant) and p value for 293T = 0.0012 (very significant). (G) Effect of combination of chlorpromazine and sucrose on viral entry. Viral infectivity was measured following pre-treatment with a combination of 10 μg/ml chlorpromazine and 0.45 M sucrose for 45 min. Error bars represent SEM for three independent infection samples. * p value for EbGP = 0.0125 (significant) and p value for HIV = 0.0309 (significant).
Fig. 4
Dominant-negative Eps15 inhibits EbGP mediated viral entry. (A) Transfection of HOS cells with mRFP-D3Δ2 control Eps15 plasmid (left panel) or mRFP-DIII dominant-negative (DN) Eps15 plasmid (right panel) followed by incubation with Fluorescein-transferrin for 30 min. The nuclei were stained with Hoechst. Red represents Eps15 transfected cells, green represents transferrin and blue represents nuclei. Arrows indicate transferrin endocytosis in the D3Δ2 control Eps15 cells, which is comparable to neighboring untransfected cells. Scale bar represents 30 μm. (B) Fold decrease in viral infectivity in HOS cells transfected with DIII DN Eps15 when compared to D3Δ2 control Eps15 plasmid. Error bars represent SEM for three independent experiments. * p value for fold change in EbGP mediated infectivity compared to either VSVg or HIV = 0.0021 (very significant). (C) Comparison of fold decrease in EbGP mediated infectivity in HeLa, 293T and Vero cells transfected with DIII DN Eps15 when compared to D3Δ2 control Eps15 plasmid. Error bars represent SEM for three independent experiments. Typically, there was 20-30 % transfected and infected cells (double positive cells) in cells transfected with the D3Δ2 control plasmid and infected with EbGP virus in all four cell lines.
Fig. 5
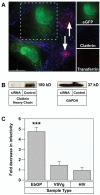
EbGP mediated viral infection is inhibited by siRNA-mediated knockdown of clathrin heavy chain. (A) Co-transfection of HOS cells with eGFP and siRNA against clathrin heavy chain followed by incubation with 14 μg/ml of TR-transferrin for 30 min. Cells were fixed and stained for clathrin (shown in blue) using mouse monoclonal antibody against clathrin heavy chain and Cy5-conjugated anti-mouse secondary antibody. Arrows indicate transferrin endocytosis in the neighboring untransfected cells. Scale bar represents 15 μm. The side panels show individual channels in a single siRNA transfected cell (co-transfected with eGFP) and demonstrate that there is very little clathrin and no internalized transferrin in that GFP expressing cell. (B) HOS cells in 12 well plates were transfected twice with siRNA against clathrin followed by western blot detection of clathrin using mouse monoclonal antibody against clathrin heavy chain. GAPDH was measured as a loading control. (C) HOS cells on coverslips were transfected twice with siRNA against clathrin heavy chain and mCherry plasmid as a transfection marker. Control cells were transfected with mCherry plasmid alone. 48 h following the second transfection, the cells were incubated with virus for 4 h. 48 h post-infection, the cells were fixed and the DNA was stained with Hoechst. Several panels of images were collected from each sample and the number of transfected cells and transfected and infected cells were counted in each panel. Graph represents the fold decrease in viral infectivity in siRNA-transfected cells when compared to control cells. Error bars represent SEM for three independent experiments. * p value for fold change in EbGP mediated infectivity compared to either VSVg or HIV = 0.0006 (extremely significant). Typically, there was 20 % transfected and infected cells (double positive cells) in control cells infected with EbGP virus and 25 % transfected and infected cells in siRNA-treated as well as control cells for VSVg and HIV infection.
Fig. 6
Baf A1 and chlorpromazine inhibit replication-competent EBOV infection. (A) Vero E6 cells were seeded in 96 well plates and pretreated with 10 nM Baf A1 before infection with ZEBOV-GFP. After 1 h attachment of virus, cells were washed and incubated with medium alone for 48 h, fixed and the infected cells visualized and quantified by Discovery 1 microscope for 9 regions per well. Error bars represent SEM for three independent infection samples. * p value = 0.0028 (very significant). (B) Effect of chlorpromazine on viability of Vero E6 cells. Cells were treated with increasing concentrations of chlorpromazine for 48 h and cell viability was measured by Sytox green staining and quantification of cells using Discovery 1 microscope. (C) Vero cells were plated in 96 well plates and treated with different concentrations of chlorpromazine and infected with ZEBOV-GFP at an MOI of 1. After virus attachment and washing the excess virus, media containing the same concentrations of drug were replenished. After 48 h, the cells were fixed and percent infection determined using Discovery 1 microscope for 9 regions per well. Error bars represent SEM for three independent infection samples. (D) Images captured with Discovery 1 microscope from infected cells treated with medium alone (Upper panel) or 10 μg/ml chlorpromazine (Lower panel). Green represents infected cells and blue represents nuclear staining with Hoechst. Scale bar represents 50 μm. (E) HeLa cells were treated with different concentrations of chlorpromazine and infected with ZEBOV-GFP as described above in (C). 48 h later, the cells were fixed and percent infection determined using Discovery 1 microscope for 9 regions per well. Error bars represent SEM for three independent infection samples.
Similar articles
- Ebolavirus is internalized into host cells via macropinocytosis in a viral glycoprotein-dependent manner.
Nanbo A, Imai M, Watanabe S, Noda T, Takahashi K, Neumann G, Halfmann P, Kawaoka Y. Nanbo A, et al. PLoS Pathog. 2010 Sep 23;6(9):e1001121. doi: 10.1371/journal.ppat.1001121. PLoS Pathog. 2010. PMID: 20886108 Free PMC article. - Identification of entry inhibitors of Ebola virus pseudotyped vectors from a myxobacterial compound library.
Beck S, Henß L, Weidner T, Herrmann J, Müller R, Chao YK, Grimm C, Weber C, Sliva K, Schnierle BS. Beck S, et al. Antiviral Res. 2016 Aug;132:85-91. doi: 10.1016/j.antiviral.2016.05.017. Epub 2016 May 27. Antiviral Res. 2016. PMID: 27241689 - Differential requirements for clathrin endocytic pathway components in cellular entry by Ebola and Marburg glycoprotein pseudovirions.
Bhattacharyya S, Hope TJ, Young JA. Bhattacharyya S, et al. Virology. 2011 Oct 10;419(1):1-9. doi: 10.1016/j.virol.2011.07.018. Epub 2011 Aug 19. Virology. 2011. PMID: 21855102 Free PMC article. - [Research progress on ebola virus glycoprotein].
Ding GY, Wang ZY, Gao L, Jiang BF. Ding GY, et al. Bing Du Xue Bao. 2013 Mar;29(2):233-7. Bing Du Xue Bao. 2013. PMID: 23757858 Review. Chinese. - Molecular Mechanism of Externalization of Phosphatidylserine on the Surface of Ebola Virus Particles.
Nanbo A, Kawaoka Y. Nanbo A, et al. DNA Cell Biol. 2019 Feb;38(2):115-120. doi: 10.1089/dna.2018.4485. Epub 2019 Jan 7. DNA Cell Biol. 2019. PMID: 30615471 Review.
Cited by
- Filovirus entry: a novelty in the viral fusion world.
Hunt CL, Lennemann NJ, Maury W. Hunt CL, et al. Viruses. 2012 Feb;4(2):258-75. doi: 10.3390/v4020258. Epub 2012 Feb 7. Viruses. 2012. PMID: 22470835 Free PMC article. Review. - Identification of 53 compounds that block Ebola virus-like particle entry via a repurposing screen of approved drugs.
Kouznetsova J, Sun W, Martínez-Romero C, Tawa G, Shinn P, Chen CZ, Schimmer A, Sanderson P, McKew JC, Zheng W, García-Sastre A. Kouznetsova J, et al. Emerg Microbes Infect. 2014 Dec;3(12):e84. doi: 10.1038/emi.2014.88. Epub 2014 Dec 17. Emerg Microbes Infect. 2014. PMID: 26038505 Free PMC article. - Filovirus entry.
Simmons G. Simmons G. Adv Exp Med Biol. 2013;790:83-94. doi: 10.1007/978-1-4614-7651-1_5. Adv Exp Med Biol. 2013. PMID: 23884587 Free PMC article. Review. - Antiviral activity of chlorpromazine, fluphenazine, perphenazine, prochlorperazine, and thioridazine towards RNA-viruses. A review.
Otręba M, Kośmider L, Rzepecka-Stojko A. Otręba M, et al. Eur J Pharmacol. 2020 Nov 15;887:173553. doi: 10.1016/j.ejphar.2020.173553. Epub 2020 Sep 16. Eur J Pharmacol. 2020. PMID: 32949606 Free PMC article. Review. - Cellular entry of ebola virus involves uptake by a macropinocytosis-like mechanism and subsequent trafficking through early and late endosomes.
Saeed MF, Kolokoltsov AA, Albrecht T, Davey RA. Saeed MF, et al. PLoS Pathog. 2010 Sep 16;6(9):e1001110. doi: 10.1371/journal.ppat.1001110. PLoS Pathog. 2010. PMID: 20862315 Free PMC article.
References
- Benmerah A, Bayrou M, Cerf-Bensussan N, Dautry-Varsat A. Inhibition of clathrin-coated pit assembly by an Eps15 mutant. J Cell Sci. 1999;112(Pt 9):1303–11. - PubMed
- Benmerah A, Poupon V, Cerf-Bensussan N, Dautry-Varsat A. Mapping of Eps15 domains involved in its targeting to clathrin-coated pits. J Biol Chem. 2000;275(5):3288–95. - PubMed
Publication types
MeSH terms
Substances
Grants and funding
- R21 AI052051/AI/NIAID NIH HHS/United States
- R01 AI052051/AI/NIAID NIH HHS/United States
- R01 AI052051-06/AI/NIAID NIH HHS/United States
- R21 AI054495-02/AI/NIAID NIH HHS/United States
- R21 AI054495/AI/NIAID NIH HHS/United States
LinkOut - more resources
Full Text Sources
Medical
Molecular Biology Databases
Miscellaneous
