Sestrin as a feedback inhibitor of TOR that prevents age-related pathologies - PubMed (original) (raw)
Sestrin as a feedback inhibitor of TOR that prevents age-related pathologies
Jun Hee Lee et al. Science. 2010.
Abstract
Sestrins are conserved proteins that accumulate in cells exposed to stress, potentiate adenosine monophosphate-activated protein kinase (AMPK), and inhibit activation of target of rapamycin (TOR). We show that the abundance of Drosophila sestrin (dSesn) is increased upon chronic TOR activation through accumulation of reactive oxygen species that cause activation of c-Jun amino-terminal kinase and transcription factor Forkhead box O (FoxO). Loss of dSesn resulted in age-associated pathologies including triglyceride accumulation, mitochondrial dysfunction, muscle degeneration, and cardiac malfunction, which were prevented by pharmacological activation of AMPK or inhibition of TOR. Hence, dSesn appears to be a negative feedback regulator of TOR that integrates metabolic and stress inputs and prevents pathologies caused by chronic TOR activation that may result from diminished autophagic clearance of damaged mitochondria, protein aggregates, or lipids.
Figures
Fig. 1
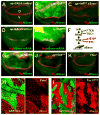
Increased abundance of dSesn upon TOR activation. Larval wing discs of indicated strains were stained to visualize indicated proteins or mRNA. The dorsal side points upwards. Dorsoventral boundary (D/V in A) was visualized by staining with an antibody to the wingless (Wg) protein (red). (A to C) Expression of dSesn protein (green) in the absence (A) or presence of InRCA in WT (B) and _dSesn_-null (C) strains. (D and E) Accumulation of dSesn mRNA (green) in response to InRCA detected by in situ hybridization. (F) The signaling network controlling TOR activity and expression of dSesn. (G to K) Accumulation of dSesn (green) in response to Rheb (G) but not S6KCA (J) or loss of 4E-BP (K). Thor1 is a Drosophila 4E-BP loss-of-function mutant. (H and I) Accumulation of dSesn after somatic loss of PTEN (H) or TSC1 (I). Absence of GFP (green) indicates loss of PTEN or TSC1 resulting in dSesn (red) accumulation.
Fig. 2
Chronic TOR activation results in accumulation of ROS and dSesn. Larval imaginal discs of indicated strains were stained as indicated. (A) ROS accumulation (red) in response to InRCA or Rheb overexpressed in dorsal (upwards) wing discs was revealed by DHE staining. (B) InRCA-induced ROS (red) accumulation in eye discs was reduced by PI3KDN or TORDN but not by S6KDN or 4E-BPCA. (C) DHE staining (red) in TSC1-negative wing disc clones marked by absence of GFP. (D and E) Inhibition of InRCA-induced accumulation of dSesn (green) in eye and wing discs by expression of catalase or peroxiredoxin (Prx). D-V wing boundary and differentiated eye area were visualized by Wg (red) and Elav (red) staining, respectively. (F) dSesn accumulation (red) in TSC1-negative wing disc clones was suppressed by vitamin E feeding. Absence of GFP (green) indicates loss of TSC1. (G) Diagram depicting TOR-stimulated production of ROS and expression of dSesn.
Fig. 3
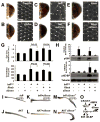
Antagonism of TOR-stimulated growth by dSesn. (A to F) Light (left) and scanning electron (right) micrographs of eyes expressing the indicated genetic elements driven by gmr-GAL4. Scale bar, 20 μm. (G) Quantification of eye and ommatidia sizes measured from frontal and lateral views, respectively. P values were calculated by one-way ANOVA. Error bars=S.D.; n=3 and 5, respectively. (H) Suppression of TOR signaling by dSesn. Adult heads with eye-specific expression of indicated genetic elements driven by _gmr_-GAL4 were subjected to immunoblot analyses with indicated antibodies. Relative band intensities were quantified and are presented as bar graphs. Error bars=S.D. n=3. (I to N) Suppression of InR-induced growth by dSesn. Anterior views of wing blades with _apterous-GAL4_-driven expression of indicated genetic elements. Dorsal sides point upwards. (O) Schematic diagram summarizing genetic interactions between dSesn and TOR signaling components.
Fig. 4
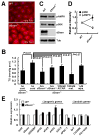
Effect of dSesn on lipid homeostasis. (A) Lipid accumulation in fat bodies examined by Nile Red staining (red). (B) Total triglycerides were measured in five 10-day-old adult males of the indicated genotypes subjected to the indicated treatments (met., metformin; rapa., rapamycin). P values were calculated by one-way ANOVA. Error bars=S.D.; n≥3. (C and D) Protein lysates from fat bodies were analyzed by immunoblotting with indicated antibodies. Relative band intensities were quantified and are shown as a bar graph. Error bars=S.D.; n=3. (E) Expression of indicated mRNAs in adult flies was examined by quantitative RT-PCR. Fifty 3-day-old adult males of each genotype were used to prepare total RNA. Error bars=S.D.; n=3.
Fig. 5
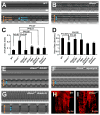
Effect of dSesn on cardiac function. (A, B, E to G) Representative M mode records of indicated 2-week-old flies fed without or with indicated drugs, showing movement of heart tube walls (y-axis) over time (x-axis). Diastolic (orange) and systolic (blue) diameters are indicated. 1 second is indicated as a bar. (C and D) Quantification of cardiac function parameters. P values were calculated using one-way ANOVA. Error bars indicate S.E.M.; n>10. (H and I) Actin fibers in WT and _dSesn_-null hearts were visualized by phalloidin staining (red).
Fig. 6
Effect of dSesn on progressive muscle degeneration. Thoracic skeletal muscles of indicated 20-day-old male flies treated without or with indicated drugs were analyzed by transmission electron microscopy (TEM). Left panels: sarcomeres; right panels: mitochondria. Mitochondrial microstructure is shown in the insets (0.15 μm width). Scale bars, 0.2 μm.
Fig. 7
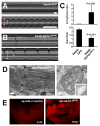
Phenotypes caused by silencing of dATG1. (A and B) Representative M mode records of control and _dATG1RNAi_-expressing hearts from 2-week-old adult flies, showing the movement of heart tube walls (y-axis) over time (x-axis). Diastolic (orange) and systolic (blue) diameters are indicated. 1 second is indicated as a bar. (C) Quantification of cardiac function parameters. P values were calculated using one-way ANOVA. Error bars indicate S.E.M.; n≥9. (D) _dATG1RNAi_-expressing thoracic skeletal muscle was analyzed by TEM. Left panel: sarcomeres; right panel: mitochondria. Mitochondrial microstructure is shown in the insets (0.15 μm width). Scale bars, 0.2 μm. (E) ROS accumulation (red) in response to dATG1RNAi expressed in dorsal (upwards) wing discs revealed by DHE staining.
Comment in
- Cell biology. Burn out or fade away?
Topisirovic I, Sonenberg N. Topisirovic I, et al. Science. 2010 Mar 5;327(5970):1210-1. doi: 10.1126/science.1187497. Science. 2010. PMID: 20203039 No abstract available.
Similar articles
- Cell biology. Burn out or fade away?
Topisirovic I, Sonenberg N. Topisirovic I, et al. Science. 2010 Mar 5;327(5970):1210-1. doi: 10.1126/science.1187497. Science. 2010. PMID: 20203039 No abstract available. - The Drosophila homolog of methionine sulfoxide reductase A extends lifespan and increases nuclear localization of FOXO.
Chung H, Kim AK, Jung SA, Kim SW, Yu K, Lee JH. Chung H, et al. FEBS Lett. 2010 Aug 20;584(16):3609-14. doi: 10.1016/j.febslet.2010.07.033. Epub 2010 Jul 23. FEBS Lett. 2010. PMID: 20655917 - TOR coordinates bulk and targeted endocytosis in the Drosophila melanogaster fat body to regulate cell growth.
Hennig KM, Colombani J, Neufeld TP. Hennig KM, et al. J Cell Biol. 2006 Jun 19;173(6):963-74. doi: 10.1083/jcb.200511140. J Cell Biol. 2006. PMID: 16785324 Free PMC article. - Sestrins orchestrate cellular metabolism to attenuate aging.
Lee JH, Budanov AV, Karin M. Lee JH, et al. Cell Metab. 2013 Dec 3;18(6):792-801. doi: 10.1016/j.cmet.2013.08.018. Epub 2013 Sep 19. Cell Metab. 2013. PMID: 24055102 Free PMC article. Review. - Recent Insights into the Biological Functions of Sestrins in Health and Disease.
Wang M, Xu Y, Liu J, Ye J, Yuan W, Jiang H, Wang Z, Jiang H, Wan J. Wang M, et al. Cell Physiol Biochem. 2017;43(5):1731-1741. doi: 10.1159/000484060. Epub 2017 Oct 19. Cell Physiol Biochem. 2017. PMID: 29050006 Review.
Cited by
- Misexpression screen delineates novel genes controlling Drosophila lifespan.
Paik D, Jang YG, Lee YE, Lee YN, Yamamoto R, Gee HY, Yoo S, Bae E, Min KJ, Tatar M, Park JJ. Paik D, et al. Mech Ageing Dev. 2012 May;133(5):234-45. doi: 10.1016/j.mad.2012.02.001. Epub 2012 Feb 24. Mech Ageing Dev. 2012. PMID: 22366109 Free PMC article. - Conserved regulators of Rag GTPases orchestrate amino acid-dependent TORC1 signaling.
Powis K, De Virgilio C. Powis K, et al. Cell Discov. 2016 Mar 8;2:15049. doi: 10.1038/celldisc.2015.49. eCollection 2016. Cell Discov. 2016. PMID: 27462445 Free PMC article. Review. - Obesity-associated cardiac dysfunction in starvation-selected Drosophila melanogaster.
Hardy CM, Birse RT, Wolf MJ, Yu L, Bodmer R, Gibbs AG. Hardy CM, et al. Am J Physiol Regul Integr Comp Physiol. 2015 Sep 15;309(6):R658-67. doi: 10.1152/ajpregu.00160.2015. Epub 2015 Jul 1. Am J Physiol Regul Integr Comp Physiol. 2015. PMID: 26136533 Free PMC article. - Progressive transcriptional changes in metabolic genes and altered fatbody homeostasis in Drosophila model of Huntington's disease.
Singh A, Agrawal N. Singh A, et al. Metab Brain Dis. 2022 Dec;37(8):2783-2792. doi: 10.1007/s11011-022-01078-2. Epub 2022 Sep 19. Metab Brain Dis. 2022. PMID: 36121619 - Effects of exercise on cellular and tissue aging.
Carapeto PV, Aguayo-Mazzucato C. Carapeto PV, et al. Aging (Albany NY). 2021 May 13;13(10):14522-14543. doi: 10.18632/aging.203051. Epub 2021 May 13. Aging (Albany NY). 2021. PMID: 34001677 Free PMC article. Review.
References
- Wullschleger S, Loewith R, Hall MN. Cell. 2006;124:471. - PubMed
- Hay N, Sonenberg N. Genes Dev. 2004;18:1926. - PubMed
- Oldham S, Hafen E. Trends Cell Biol. 2003;13:79. - PubMed
- Towler MC, Hardie DG. Circ Res. 2007;100:328. - PubMed
Publication types
MeSH terms
Substances
Grants and funding
- AI070654/AI/NIAID NIH HHS/United States
- P30-CA23100/CA/NCI NIH HHS/United States
- CA118165/CA/NCI NIH HHS/United States
- K99 DK082080/DK/NIDDK NIH HHS/United States
- P42-ES010337/ES/NIEHS NIH HHS/United States
- P42 ES010337/ES/NIEHS NIH HHS/United States
- R01 ES006376-17/ES/NIEHS NIH HHS/United States
- DK082080/DK/NIDDK NIH HHS/United States
- ES006376/ES/NIEHS NIH HHS/United States
- P42 ES010337-10S20010/ES/NIEHS NIH HHS/United States
- P41 RR004050/RR/NCRR NIH HHS/United States
- P30 CA023100/CA/NCI NIH HHS/United States
- R01 CA118165/CA/NCI NIH HHS/United States
- P41-RR004050/RR/NCRR NIH HHS/United States
- NS29870/NS/NINDS NIH HHS/United States
- R01 ES006376/ES/NIEHS NIH HHS/United States
- R01 CA118165-04/CA/NCI NIH HHS/United States
LinkOut - more resources
Full Text Sources
Other Literature Sources
Medical
Molecular Biology Databases
Research Materials
Miscellaneous
