Loss of type III transforming growth factor-beta receptor expression is due to methylation silencing of the transcription factor GATA3 in renal cell carcinoma - PubMed (original) (raw)
. 2010 May 20;29(20):2905-15.
doi: 10.1038/onc.2010.64. Epub 2010 Mar 8.
H Zou, S N Legrand, L A Marlow, C A von Roemeling, D C Radisky, K J Wu, N Hempel, V Margulis, H W Tun, G C Blobe, C G Wood, J A Copland
Affiliations
- PMID: 20208565
- PMCID: PMC3472631
- DOI: 10.1038/onc.2010.64
Loss of type III transforming growth factor-beta receptor expression is due to methylation silencing of the transcription factor GATA3 in renal cell carcinoma
S J Cooper et al. Oncogene. 2010.
Abstract
Loss of transforming growth factor-beta receptor III (TbetaRIII) correlates with loss of transforming growth factor-beta (TGF-beta) responsiveness and suggests a role for dysregulated TGF-beta signaling in clear cell renal cell carcinoma (ccRCC) progression and metastasis. Here we identify that for all stages of ccRCC TbetaRIII expression is downregulated in patient-matched tissue samples and cell lines. We find that this loss of expression is not due to methylation of the gene and we define GATA3 as the first transcriptional factor to positively regulate TbetaRIII expression in human cells. We localize GATA3's binding to a 10-bp region of the TbetaRIII proximal promoter. We demonstrate that GATA3 mRNA is downregulated in all stages, of ccRCC, mechanistically show that GATA3 is methylated in ccRCC patient tumor tissues as well as cell lines, and that inhibiting GATA3 expression in normal renal epithelial cells downregulates TbetaRIII mRNA and protein expression. These data support a sequential model whereby loss of GATA3 expression through epigenetic silencing decreases TbetaRIII expression during ccRCC progression.
Conflict of interest statement
Conflict of Interest: The authors have nothing to disclose.
Figures
Fig. 1
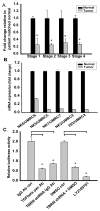
Expression and biological activity of TβRIII is attenuated in ccRCC. A. Real Time PCR analysis of the expression of TβRIII in patient-matched tissues for all stages of ccRCC (n=10 samples per stage) using primers specific to translated exon regions of the TβRIII mRNA. B. Real Time PCR analysis of TβRIII mRNA expression in patient-matched normal renal primary cultured cells and cRCC cell lines. (Stage 1, UMRC6; Stage 3, UMRC5 and UMRC7; Stage 4, UMRC2). The human embryonic renal cell line, HEK 293 cells were used as “normal” renal cells. Data is plotted as the mean +/− standard deviation (SD). C. HEK 293 cells were infected with a non-target or TβRIII shRNA before undergoing transient transfection with a Smad 2/3 transcriptional reporter (CAGA12/luciferase). Levels of TβRIII mRNA expression were reduced by 60% after TβRIII shRNA infection (data not shown). These non-target or TβRIII shRNA infected cells were treated with a pan TGF-β neutralizing antibody or 50μM LY2109761 with appropriate controls and analyzed for luciferase activity to demonstrate that TGF-β signaling was mediated via TβRIII.
Fig. 2
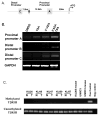
Re-expression of the proximal and distal promoters of TβRIII following exposure to methylation and HDAC inhibitors. A. The 3 5′UTR regions (A, B and C) and the distance of these promoters from the ATG start site of the TβRIII gene are shown. B. Using PCR specific forward primers for each of the 5′UTRs (A, B, & C) and a reverse primer located in the first coding exon of the TβRIII gene, we identify that mRNA expression of the 3 promoters are upregulated following exposure of UMRC2 cells to 10μM 5-Aza-2′-deoxycytidine (5′AZA) and 0.5μM TSA. C. Patient-matched samples (n=5) and ccRCC derived cell lines (UMRC3) grown in athymic nude mice (KIJ265 mouse and UMRC3 mouse) were examined for methylation of the TβRIII gene (N=normal, T=tumor). Methylation specific PCR was carried out on bisulfite-treated genomic DNA. Specific primers were utilized to amplify methylated or unmethylated sequences of the TβRIII gene.
Fig. 3
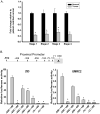
Expression of TβRIII mRNA resides in the proximal promoter. A. Expression of the TβRIII mRNA using PCR primers specific to the 5″ region of the untranslated region of the proximal promoter in patient-matched normal renal and ccRCC tissues identify identical expression patterns to that seen in Figure 1A. B. Deletions within the proximal promoter (identified within the cartoon) lead to a significant loss of luciferase activity. All deletions were created within the pGL3Basic vector and transfected into cells as described in the Experimental Procedures section. Results were normalized to TK renilla luciferase activity, expressed as relative luciferase activity (RLU) and shown as the mean +/− SD (n=3). C. Positive regulator of proximal promoter expression is identified to be within the first 50bp of the −559/+60 promoter. A representative diagram is shown for the sequence of the first 50bp of the −559/+60 proximal promoter identifying putative transcription factor binding sites and areas deleted or mutated within this region. Cells were transfected with the deletion constructs, samples collected and analyzed as in Materials and Methods. The data was normalized to TK renilla luciferase activity and shown as the mean +/− SD (n=3).
Fig. 4
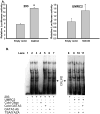
hGATA3 is identified as a transcriptional factor positively regulating TβRIII mRNA via the TβRIII proximal promoter. A. The TβRIII proximal promoter construct (−559/+60 luciferase), TK renilla luciferase, human GATA3 or an empty expression vector control were transiently transfected into HEK293 and UMRC2 cell lines as described in Materials and Methods. After collection, cell lysates were analyzed for firefly luciferase activity and normalized to TK renilla luciferase. Results are expressed as mean +/−SD (* = p<0.05 student T-test). B. EMSA analysis was performed on nuclear extracts from HEK 293 and UMRC2 cells as described in the Experimental Procedures section to identify transcriptional factor(s) binding to the first 25bp sequence of the TβRIII proximal promoter. Incubation with a non-biotin labeled GATA3 consensus oligo sequence or an antibody specific for GATA3 identified a single band corresponding to the GATA3 DNA binding complex. 293 nuclear extracts were used as a control to identify loss of GATA3 binding in UMRC2 cells compared to 293 nuclear extracts and TSA/5′AZA treated UMRC2 cells.
Fig. 5
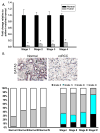
Expression of GATA3 is down-regulated in ccRCC. A. Real Time analysis of patient-matched normal renal and ccRCC tissue samples identified loss of GATA3 mRNA expression in all 4 stages of ccRCC (10 samples per stage). B. IHC analysis identified loss of GATA3 protein expression in all ccRCC stages compared to normal matched tissue. Representative images from normal and stage 4 ccRCC stained tissue are shown and graded scores were converted into percentage categories and graphed. C. Patient-matched normal renal and ccRCC tissue and ccRCC cell lines were investigated for their GATA3 methylation status as described previously. Methylation of GATA3 was observed to be present in normal (N) and tumor tissues (T) but was more highly methylated in ccRCC tissue samples. Eight clones were sequenced for each sample with open circles representing unmethylated CpG sites and closed circles representing methylated CpG sites. TβRIII bisulphate genomic sequencing was included to confirm negative methylation. D. Treatment of UMRC2 cells with TSA and or 5′AZA increase mRNA expression of GATA3 compared to non-treated controls. Cells were treated (10μM 5′AZA/0.5μM TSA) and collected as described in the Materials and Methods section before undergoing Real Time PCR analysis. Data is shown as mean +/−SD (n=3).
Fig. 6
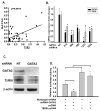
Inhibition of endogenous GATA3 down-regulated TβRIII mRNA expression in normal renal cells. A. Correlation of TβRIII and GATA3 expression in stage 1–4 ccRCC patient-matched normal and ccRCC tissue samples (p=0.0013). B. Infection of HEK293 cells with non-target and 5 variant shRNA lentiviral constructs specific for GATA3 were harvested before undergoing Real Time PCR analysis. Results are shown as mean fold expression compared to non-target controls +/− SD (n=3). C. Western blot analysis of lentiviral shRNA GATA3 infected 293 cells was used to verify loss of GATA3 protein expression and identify modulations of TβRIII.β-actin was used as a protein loading control. D. Lentiviral knockdown of GATA3 in 293 cells decreases TGF-β/Smad responsiveness in normal cells mediated via the loss of TβRIII. Cells were treated as described in the Materials and Methods section.
Similar articles
- Genomic profiling identifies alterations in TGFbeta signaling through loss of TGFbeta receptor expression in human renal cell carcinogenesis and progression.
Copland JA, Luxon BA, Ajani L, Maity T, Campagnaro E, Guo H, LeGrand SN, Tamboli P, Wood CG. Copland JA, et al. Oncogene. 2003 Sep 11;22(39):8053-62. doi: 10.1038/sj.onc.1206835. Oncogene. 2003. PMID: 12970754 - TGFBR3 co-downregulated with GATA3 is associated with methylation of the GATA3 gene in bladder urothelial carcinoma.
Liu XL, Xue BX, Lei Z, Yang DR, Zhang QC, Shan YX, Zhang HT. Liu XL, et al. Anat Rec (Hoboken). 2013 Nov;296(11):1717-23. doi: 10.1002/ar.22802. Epub 2013 Oct 4. Anat Rec (Hoboken). 2013. PMID: 24124001 - Effects of TGF-β signaling in clear cell renal cell carcinoma cells.
Boström AK, Lindgren D, Johansson ME, Axelson H. Boström AK, et al. Biochem Biophys Res Commun. 2013 May 24;435(1):126-33. doi: 10.1016/j.bbrc.2013.04.054. Epub 2013 Apr 22. Biochem Biophys Res Commun. 2013. PMID: 23618868 - The type III TGF-beta receptor suppresses breast cancer progression through GIPC-mediated inhibition of TGF-beta signaling.
Lee JD, Hempel N, Lee NY, Blobe GC. Lee JD, et al. Carcinogenesis. 2010 Feb;31(2):175-83. doi: 10.1093/carcin/bgp271. Epub 2009 Dec 2. Carcinogenesis. 2010. PMID: 19955393 Free PMC article. - Roles for the type III TGF-beta receptor in human cancer.
Gatza CE, Oh SY, Blobe GC. Gatza CE, et al. Cell Signal. 2010 Aug;22(8):1163-74. doi: 10.1016/j.cellsig.2010.01.016. Epub 2010 Feb 12. Cell Signal. 2010. PMID: 20153821 Free PMC article. Review.
Cited by
- Genetic and epigenetic alterations during renal carcinogenesis.
Arai E, Kanai Y. Arai E, et al. Int J Clin Exp Pathol. 2010 Dec 13;4(1):58-73. Int J Clin Exp Pathol. 2010. PMID: 21228928 Free PMC article. Review. - Identification of genes associated with renal cell carcinoma using gene expression profiling analysis.
Yao T, Wang Q, Zhang W, Bian A, Zhang J. Yao T, et al. Oncol Lett. 2016 Jul;12(1):73-78. doi: 10.3892/ol.2016.4573. Epub 2016 May 16. Oncol Lett. 2016. PMID: 27347102 Free PMC article. - An integrative genomics approach for identifying novel functional consequences of PBRM1 truncated mutations in clear cell renal cell carcinoma (ccRCC).
Wang Y, Guo X, Bray MJ, Ding Z, Zhao Z. Wang Y, et al. BMC Genomics. 2016 Aug 22;17 Suppl 7(Suppl 7):515. doi: 10.1186/s12864-016-2906-9. BMC Genomics. 2016. PMID: 27556922 Free PMC article. - The multi-faceted role of Gata3 in developmental haematopoiesis.
Zaidan N, Ottersbach K. Zaidan N, et al. Open Biol. 2018 Nov 21;8(11):180152. doi: 10.1098/rsob.180152. Open Biol. 2018. PMID: 30463912 Free PMC article. Review. - Epigenetic Alteration by DNA Promoter Hypermethylation of Genes Related to Transforming Growth Factor-β (TGF-β) Signaling in Cancer.
Khin SS, Kitazawa R, Kondo T, Idei Y, Fujimoto M, Haraguchi R, Mori K, Kitazawa S. Khin SS, et al. Cancers (Basel). 2011 Mar 3;3(1):982-93. doi: 10.3390/cancers3010982. Cancers (Basel). 2011. PMID: 24212650 Free PMC article.
References
- Chakravarthy D, Green AR, Green VL, Kerin MJ, Speirs V. Expression and secretion of TGF-beta isoforms and expression of TGF-beta-receptors I, II and III in normal and neoplastic human breast. Int J Oncol. 1999;15:187–94. - PubMed
- Cooper S, Ranger-Moore J, Bowden TG. Differential inhibition of UVB-induced AP-1 and NF-kappaB transactivation by components of the jun bZIP domain. Mol Carcinog. 2005;43:108–16. - PubMed
- Copland JA, Luxon BA, Ajani L, Maity T, Campagnaro E, Guo H, et al. Genomic profiling identifies alterations in TGFbeta signaling through loss of TGFbeta receptor expression in human renal cell carcinogenesis and progression. Oncogene. 2003;22:8053–62. - PubMed
- Copland JA, Marlow LA, Kurakata S, Fujiwara K, Wong AK, Kreinest PA, et al. Novel high-affinity PPARgamma agonist alone and in combination with paclitaxel inhibits human anaplastic thyroid carcinoma tumor growth via p21WAF1/CIP1. Oncogene. 2006;25:2304–17. - PubMed
Publication types
MeSH terms
Substances
Grants and funding
- 3R01CA104505-05S1/CA/NCI NIH HHS/United States
- CA104505/CA/NCI NIH HHS/United States
- R01 CA104505/CA/NCI NIH HHS/United States
- R01 CA106307/CA/NCI NIH HHS/United States
- CA106307/CA/NCI NIH HHS/United States
LinkOut - more resources
Full Text Sources
Other Literature Sources
Medical
