FOXO3a governs early and late apoptotic endothelial programs during elevated glucose through mitochondrial and caspase signaling - PubMed (original) (raw)
FOXO3a governs early and late apoptotic endothelial programs during elevated glucose through mitochondrial and caspase signaling
Jinling Hou et al. Mol Cell Endocrinol. 2010.
Abstract
Mechanisms that preserve endothelial cell (EC) integrity remain elusive, but are critical for new strategies directed against endocrine disorders such as diabetes mellitus (DM). Here we demonstrate in primary cerebral ECs with a clinically relevant model of elevated d-glucose that Akt1 and the post-translational modification and subcellular trafficking of the forkhead transcription factor FoxO3a are critical for early apoptotic membrane signaling and subsequent degradation of nuclear DNA. FoxO3a also directly governs apoptotic mitochondrial signal transduction pathways, since gene knockdown of FoxO3a prevents mitochondrial membrane depolarization as well as the release of cytochrome c. Control of this apoptotic cascade extends to the rapid and progressive activation of caspases. The presence of FoxO3a is necessary for cleaved (active) caspase 1 and 3 expression, since loss of FoxO3a abrogates the induction of caspase activity. Our work identifies Akt1, FoxO3a and closely aligned pathways as key therapeutic targets during impaired glucose tolerance and DM.
Copyright 2010 Elsevier Ireland Ltd. All rights reserved.
Conflict of interest statement
Conflict of interest: The authors have nothing to disclose.
Figures
Fig. 1. Elevated D-glucose leads to EC injury with early and late apoptotic damage
(A) Primary cerebral ECs were exposed to elevated D-glucose at the concentration of 10, 20, 50, 75 mM and EC survival (trypan blue, TB) was determined 48 hours later. Representative images illustrate increased trypan blue staining during elevated glucose. (B) Quantification of data demonstrates that EC survival (trypan blue, TB) was significantly decreased to 55 ± 5% (20 mM), 39 ± 4% (50 mM), and 36 ± 4% (75 mM) following administration of elevated (high) D-glucose when compared with untreated control cultures (98 ± 1%, *P <0.01 vs. Control). Each data point represents the mean and SEM from 6 experiments. (A) Primary cerebral ECs were exposed to elevated D-glucose at the concentration of 10, 20, 50, 75 mM and EC apoptotic DNA fragmentation with TUNEL (TUNEL) was determined 48 hours later. Representative images illustrate increased DNA fragmentation during elevated glucose. (B) Quantification of data demonstrates that EC apoptosis (DNA) was significantly increased to 38 ± 4% (20 mM), 59 ± 4% (50 mM), and 62 ± 3% (75 mM) following administration of elevated (high) D-glucose when compared with untreated control cultures (3 ± 1%, *P <0.01 vs. Control). Each data point represents the mean and SEM from 6 experiments. (C) Representative images show that elevated D-glucose (HG = high glucose, 20 mM) leads to apoptotic DNA fragmentation (dark nuclei) with TUNEL stain and membrane PS externalization with transmitted (T) light and corresponding fluorescence (F) assessed by annexin V phycoerythrin (green fluorescence) twenty-four hours following elevated D-glucose. (D) Elevated D-glucose (HG = high glucose, 20 mM) exposure significantly increased DNA fragmentation (DNA) and PS exposure (PS) in ECs (*P<0.01 vs. untreated control). Each data point represents the mean and SEM from 6 experiments.
Fig. 2. Elevated D-glucose results in the eventual loss of phosphorylation of Akt1 and the increased activity of FoxO3a
In A and B, primary EC protein extracts (50 µ/lane) were immunoblotted with anti-phosphorylated-Akt1 (p-Akt1, Ser473) or anti-total Akt1 at 0 (control), 6, 24, and 48 hours following administration of elevated D-glucose (HG = high glucose, 20 mM). Phosphorylated (active) Akt1 (p-Akt1) expression is initially increased at 6 hours following elevated D-glucose, but subsequently is reduced and returns to control levels at 24 hours and 48 hours after elevated D-glucose (*P<0.01 vs. control). Total Akt1 is not altered. In C and D, primary EC protein extracts (50 µ/lane) were immunoblotted with anti-phosphorylated-FoxO3a (p-FoxO3a, Ser253) or anti-total FoxO3a at 0, 6, 24, and 48 hours following administration of elevated D-glucose (HG = high glucose, 20 mM). Correlating with Akt1 activity, active (unphosphorylated) FoxO3a (p-FoxO3a) expression is increased at 12, 24, and 48 hours after elevated D-glucose but total FoxO3a is not affected (*P<0.01 vs. control).
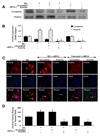
Fig. 3. Activation of FoxO3a leads to subcellular trafficking of FoxO3a to the nucleus
(A) Equal amounts of cytoplasmic (cytoplasm) or nuclear (nucleus) protein extracts (50 µg/lane) were immunoblotted with anti-total FoxO3a at 48 hours following administration of elevated D-glucose (HG = high glucose, 20 mM). Elevated D-glucose leads to the translocation of FoxO3a from the cytoplasm to the nucleus, but gene knockdown of FoxO3α blocked subcellular translocation of FoxO3a form the cytoplasm to the cell nucleus. Non-specific scrambled siRNA did not alter translocation of FoxO3a during elevated D-glucose. (B) Quantification of the western band intensity was performed using the public domain NIH Image program (
http://rsb.info.nih.gov/nih-image
) and demonstrates that significant expression of FoxO3a translocates to the cell nucleus 48 hours following elevated D-glucose (HG = high glucose, 20 mM), but transfection with FoxO3a blocks translocation of FoxO3a to the EC nucleus. Non-specific scrambled siRNA did not alter FoxO3a subcellular translocation and both non-specific siRNA and FoxO3a siRNA alone did not alter FoxO3a translocation in untreated control cells (untreated ECs = Control vs. HG, *P<0.01; FoxO3a siRNA vs. HG, †P<0.01). Each data point represents the mean and SEM from 6 experiments. In C and D, ECs were imaged 48 hours following elevated D-glucose (HG = high glucose, 20 mM) with immunofluorescent staining for FoxO3a (Texas-red streptavidin). Nuclei of ECs were counterstained with DAPI. In merged images, untreated control ECs have visible nuclei (dark blue in color, white arrows) that illustrate absence of FoxO3a in the nucleus. However, merged images after elevated D-glucose show ECs with completely red cytoplasm (green arrows) and minimal visibility of the nucleus with DAPI illustrating translocation of FoxO3a to the nucleus. In contrast, gene knockdown of FoxO3α with transfection of FoxO3a siRNA (siRNA) during elevated D-glucose eliminates the presence and translocation of FoxO3a from the cytoplasm to the cell nucleus during elevated D-glucose with the demonstration of dark blue nuclei (*P<0.01 vs. untreated ECs = Control; †P<0.01 vs. HG). Non-specific scrambled siRNA did not alter total FoxO3a translocation during elevated D-glucose. Quantification of the intensity of FoxO3a nuclear staining was performed using the public domain NIH Image program (
http://rsb.info.nih.gov/nih-image
).
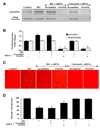
Fig. 4. Gene knockdown of FoxO3a increases EC survival during elevated D-glucose
In A and B, EC protein extracts (50 µ/lane) were immunoblotted with anti-phosphorylated-FoxO3a (p-FoxO3a, Ser253) or anti-total FoxO3a at 6 hours following elevated D-glucose (HG = high glucose, 20 mM). Gene knockdown of FoxO3a was performed with transfection of FoxO3a siRNA (siRNA). FoxO3a siRNA significantly reduced expression of total FoxO3a alone or following elevated D-glucose (HG = high glucose, 20 mM) but non-specific scrambled siRNA did not alter total FoxO3a expression (*P<0.01 vs. untreated ECs = Control; †P <0.01 vs. HG). Quantification of the western band intensity was performed using the public domain NIH Image program (
http://rsb.info.nih.gov/nih-image
). In C and D, gene knockdown of FoxO3a with FoxO3a siRNA (siRNA) significantly increased EC survival and decreased EC membrane injury assessed by trypan blue staining 48 hours after elevated D-glucose (HG = high glucose, 20 mM). FoxO3a siRNA alone was not toxic and non-specific scrambled siRNA did not protect cells during HG (*P<0.01 vs. untreated ECs = Control; †P <0.01 vs. HG). Each data point represents the mean and SEM from 6 experiments.
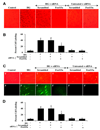
Fig. 5. Gene knockdown of FoxO3a prevents apoptotic DNA fragmentation and phosphatidylserine (PS) exposure in ECs during elevated D-glucose
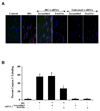
In A and C, representative images and quantitative analysis illustrate gene knockdown of FoxO3a with FoxO3a siRNA (siRNA) significantly blocks EC genomic DNA degradation assessed by TUNEL (A) and membrane PS externalization with transmitted (T) light and corresponding fluorescence (F) assessed by annexin V phycoerythrin (green fluorescence) (C) 48 hours after elevated D-glucose (HG = high glucose, 20 mM). Non-specific scrambled siRNA did not alter DNA fragmentation or membrane PS exposure. In B and D, quantification of data illustrates that DNA fragmentation and membrane PS externalization were significantly increased following elevated D-glucose (HG = high glucose, 20 mM) when compared to untreated EC control cultures, but transfection of FoxO3a siRNA prevents DNA fragmentation and membrane PS exposure during elevated D-glucose (*P<0.01 vs. untreated ECs = Control; †P <0.01 vs. HG). FoxO3a siRNA alone was not toxic and non-specific scrambled siRNA did not protect cells during elevated D-glucose. Each data point represents the mean and SEM from 6 experiments.
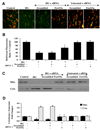
Fig. 6. Gene knockdown of FoxO3a prevents mitochondrial depolarization and the release of cytochrome c in ECs during elevated D-glucose
(A) elevated D-glucose (HG = high glucose, 20 mM) resulted in a significant decrease in the red/green fluorescence intensity ratio of mitochondria using a cationic membrane potential indicator JC-1 within 48 hours when compared with untreated control ECs, demonstrating that elevated D-glucose leads to mitochondrial membrane depolarization. Gene knockdown of FoxO3a with FoxO3a siRNA (siRNA) during elevated D-glucose significantly increased the red/green fluorescence intensity of mitochondria in ECs, indicating that mitochondrial membrane potential was restored. Non-specific scrambled siRNA did not prevent mitochondrial membrane depolarization during elevated D-glucose and FoxO3a siRNA alone did not alter mitochondrial membrane depolarization in untreated control cells. (B) The relative ratio of red/green fluorescent intensity of mitochondrial staining in both untreated control ECs and ECs exposed to elevated D-glucose (HG = high glucose, 20 mM) or transfected with FoxO3a siRNA was measured in 6 independent experiments with analysis performed using the public domain NIH Image program (
http://rsb.info.nih.gov/nih-image
) (untreated ECs = Control vs. HG, *P<0.01; FoxO3a siRNA vs. HG, †P<0.01). (C) Equal amounts of mitochondrial (mito) or cytosol (cyto) protein extracts (50 µg/lane) were immunoblotted demonstrating that transfection of FoxO3a siRNA significantly prevented cytochrome c release from mitochondria 48 hours after elevated D-glucose (HG = high glucose, 20 mM). Non-specific scrambled siRNA did not prevent cytochrome c release during elevated D-glucose. (D) Quantification of the western band intensity was performed using the public domain NIH Image program (
http://rsb.info.nih.gov/nih-image
) and demonstrates that significant release of cytochrome c occurs 48 hours following elevated D-glucose (HG = high glucose, 20 mM), but transfection with FoxO3a prevents cytochrome c release from EC mitochondria. Non-specific scrambled siRNA was ineffective during elevated D-glucose to prevent cytochrome c release and both non-specific siRNA and FoxO3a siRNA alone did not alter mitochondrial cytochrome c in untreated control cells (untreated ECs = Control vs. HG, *P<0.01; FoxO3a siRNA vs. HG, †P<0.01). Each data point represents the mean and SEM from 6 experiments
Fig. 7. FoxO3a modulates caspase 3 cellular activity during elevated D-glucose
In A, Ecs were exposed to elevated D-glucose (HG = high glucose, 20 mM) and caspase 3 activation was determined 6 hours after elevated D-glucose exposure through immunocytochemistry with antibodies against cleaved active caspase 3 (17 kDa). Representative images illustrate active caspase 3 staining (red) in cells following elevated D-glucose, but cellular red staining is almost absent during transfection with FoxO3a siRNA. Non-specific scrambled siRNA did not eliminate caspase 3 activity during elevated D-glucose and both non-specific scrambled siRNA and transfection of FoxO3a siRNA alone did not alter caspase 3 activity in untreated control cells. In B, quantification of the western band intensity was performed using the public domain NIH Image program (
http://rsb.info.nih.gov/nih-image
) and demonstrates that elevated D-glucose (HG = high glucose, 20 mM) significantly increased the expression of cleaved active caspase 3 when compared to untreated control cells. Yet, the expression of cleaved active caspase 3 was significantly decreased in cells with transfection of FoxO3a siRNA during elevated D-glucose (*P <0.01 vs. untreated ECs = Control; †P <0.01 vs. HG).
Fig. 8. Caspase 1 and 3 activities are regulated by FoxO3a during elevated D-glucose
In A, EC protein extracts (50 µg/lane) were immunoblotted with anti-cleaved caspase 3 product (active caspase 3, 17 kDA) and with anti-cleaved caspase 1 product (active caspase 1, 20 kDA) at 6, 12, 24, and 48 hours following elevated D-glucose (HG = high glucose, 20 mM). In B, quantification of the western band intensity was performed using the public domain NIH Image program (
http://rsb.info.nih.gov/nih-image
) and illustrates the highest increased caspase 3 and caspase 1 activities at 12 and 24 hours following elevated D-glucose exposure (*P <0.01 vs. untreated ECs = Control). Each data point represents the mean and SEM from 6 experiments. In C, EC protein extracts (50 µg/lane) were immunoblotted with anti-cleaved caspase 3 product (active caspase 3, 17 kDA) and with anti-cleaved caspase 1 product (active caspase 1, 20 kDA) at 12 hours following elevated D-glucose (HG = high glucose, 20 mM). Elevated D-glucose markedly increased cleaved caspase 3 and caspase 1 expression, but gene knockdown of FoxO3a with FoxO3a siRNA (siRNA) significantly blocked cleaved caspase 3 and caspase 1 expression 12 hours after elevated D-glucose. Non-specific scrambled siRNA did not eliminate caspase 3 or caspase 1 activities during elevated D-glucose and both non-specific scrambled siRNA and transfection of FoxO3a siRNA alone did not alter caspase 3 or caspase 1 activities in untreated control cells. In D, quantification of the western band intensity was performed using the public domain NIH Image program (
http://rsb.info.nih.gov/nih-image
) and shows that transfection with FoxO3a siRNA (siRNA) prevents cleaved caspase 3 and caspase 1 expression 12 hours after elevated D-glucose exposure, but non-specific scrambled siRNA did not reduce cleaved caspase 3 or caspase 1 expression during elevated D-glucose (*P <0.01 vs. untreated ECs = Control; †P <0.01 vs. HG). FoxO3a siRNA alone in untreated control cells was not toxic and each data point represents the mean and SEM from 6 experiments.
Similar articles
- Early apoptotic vascular signaling is determined by Sirt1 through nuclear shuttling, forkhead trafficking, bad, and mitochondrial caspase activation.
Hou J, Chong ZZ, Shang YC, Maiese K. Hou J, et al. Curr Neurovasc Res. 2010 May;7(2):95-112. doi: 10.2174/156720210791184899. Curr Neurovasc Res. 2010. PMID: 20370652 Free PMC article. - EPO relies upon novel signaling of Wnt1 that requires Akt1, FoxO3a, GSK-3β, and β-catenin to foster vascular integrity during experimental diabetes.
Chong ZZ, Hou J, Shang YC, Wang S, Maiese K. Chong ZZ, et al. Curr Neurovasc Res. 2011 May;8(2):103-20. doi: 10.2174/156720211795495402. Curr Neurovasc Res. 2011. PMID: 21443457 Free PMC article. - FoxO3a governs early microglial proliferation and employs mitochondrial depolarization with caspase 3, 8, and 9 cleavage during oxidant induced apoptosis.
Shang YC, Chong ZZ, Hou J, Maiese K. Shang YC, et al. Curr Neurovasc Res. 2009 Nov;6(4):223-38. doi: 10.2174/156720209789630302. Curr Neurovasc Res. 2009. PMID: 19807657 Free PMC article. - FOXO3a from the Nucleus to the Mitochondria: A Round Trip in Cellular Stress Response.
Fasano C, Disciglio V, Bertora S, Lepore Signorile M, Simone C. Fasano C, et al. Cells. 2019 Sep 19;8(9):1110. doi: 10.3390/cells8091110. Cells. 2019. PMID: 31546924 Free PMC article. Review. - Regulation of mitochondrial function by forkhead transcription factors.
Jerome MS, Kuthethur R, Kabekkodu SP, Chakrabarty S. Jerome MS, et al. Biochimie. 2022 Jul;198:96-108. doi: 10.1016/j.biochi.2022.03.013. Epub 2022 Mar 31. Biochimie. 2022. PMID: 35367579 Review.
Cited by
- Targeting disease through novel pathways of apoptosis and autophagy.
Maiese K, Chong ZZ, Shang YC, Wang S. Maiese K, et al. Expert Opin Ther Targets. 2012 Dec;16(12):1203-14. doi: 10.1517/14728222.2012.719499. Epub 2012 Aug 27. Expert Opin Ther Targets. 2012. PMID: 22924465 Free PMC article. Review. - WISP1 (CCN4) autoregulates its expression and nuclear trafficking of β-catenin during oxidant stress with limited effects upon neuronal autophagy.
Wang S, Chong ZZ, Shang YC, Maiese K. Wang S, et al. Curr Neurovasc Res. 2012 May;9(2):91-101. doi: 10.2174/156720212800410858. Curr Neurovasc Res. 2012. PMID: 22475393 Free PMC article. - mTOR: Driving apoptosis and autophagy for neurocardiac complications of diabetes mellitus.
Maiese K. Maiese K. World J Diabetes. 2015 Mar 15;6(2):217-24. doi: 10.4239/wjd.v6.i2.217. World J Diabetes. 2015. PMID: 25789103 Free PMC article. - Mitochondria, endothelial cell function, and vascular diseases.
Tang X, Luo YX, Chen HZ, Liu DP. Tang X, et al. Front Physiol. 2014 May 6;5:175. doi: 10.3389/fphys.2014.00175. eCollection 2014. Front Physiol. 2014. PMID: 24834056 Free PMC article. Review.
References
- Abbott NJ, Hughes CC, Revest PA, Greenwood J. Development and characterisation of a rat brain capillary endothelial culture: towards an in vitro blood-brain barrier. J Cell Sci. 1992;103(Pt 1):23–37. - PubMed
- Aso Y, Suganuma R, Wakabayashi S, Hara K, Nakano T, Suetsugu M, Matsumoto S, Nakamachi T, Takebayashi K, Morita K, Inukai T. Anemia is associated with an elevated serum level of high-molecular-weight adiponectin in patients with type 2 diabetes independently of renal dysfunction. Transl Res. 2009;154:175–182. - PubMed
- Ceriello A, dello Russo P, Amstad P, Cerutti P. High glucose induces antioxidant enzymes in human endothelial cells in culture. Evidence linking hyperglycemia and oxidative stress. Diabetes. 1996;45:471–477. - PubMed
Publication types
MeSH terms
Substances
Grants and funding
- R01 NS053946-04/NS/NINDS NIH HHS/United States
- P30 ES06639/ES/NIEHS NIH HHS/United States
- R01 NS053946-01A2/NS/NINDS NIH HHS/United States
- R01 NS053946-03S1/NS/NINDS NIH HHS/United States
- R01 NS053946-03/NS/NINDS NIH HHS/United States
- P30 ES006639/ES/NIEHS NIH HHS/United States
- R01 NS053946-02/NS/NINDS NIH HHS/United States
- R01 NS053946/NS/NINDS NIH HHS/United States
LinkOut - more resources
Full Text Sources
Medical
Research Materials
Miscellaneous


