Transcriptional pathway signatures predict MEK addiction and response to selumetinib (AZD6244) - PubMed (original) (raw)
. 2010 Mar 15;70(6):2264-73.
doi: 10.1158/0008-5472.CAN-09-1577. Epub 2010 Mar 9.
Sandra Pavey, Christine A Pratilas, Chris Harbron, Sarah Runswick, Darren Hodgson, Christine Chresta, Rose McCormack, Natalie Byrne, Mark Cockerill, Alexander Graham, Garry Beran, Andrew Cassidy, Carolyn Haggerty, Helen Brown, Gillian Ellison, Judy Dering, Barry S Taylor, Mitchell Stark, Vanessa Bonazzi, Sugandha Ravishankar, Leisl Packer, Feng Xing, David B Solit, Richard S Finn, Neal Rosen, Nicholas K Hayward, Tim French, Paul D Smith
Affiliations
- PMID: 20215513
- PMCID: PMC3166660
- DOI: 10.1158/0008-5472.CAN-09-1577
Transcriptional pathway signatures predict MEK addiction and response to selumetinib (AZD6244)
Jonathan R Dry et al. Cancer Res. 2010.
Abstract
Selumetinib (AZD6244, ARRY-142886) is a selective, non-ATP-competitive inhibitor of mitogen-activated protein/extracellular signal-regulated kinase kinase (MEK)-1/2. The range of antitumor activity seen preclinically and in patients highlights the importance of identifying determinants of response to this drug. In large tumor cell panels of diverse lineage, we show that MEK inhibitor response does not have an absolute correlation with mutational or phospho-protein markers of BRAF/MEK, RAS, or phosphoinositide 3-kinase (PI3K) activity. We aimed to enhance predictivity by measuring pathway output through coregulated gene networks displaying differential mRNA expression exclusive to resistant cell subsets and correlated to mutational or dynamic pathway activity. We discovered an 18-gene signature enabling measurement of MEK functional output independent of tumor genotype. Where the MEK pathway is activated but the cells remain resistant to selumetinib, we identified a 13-gene signature that implicates the existence of compensatory signaling from RAS effectors other than PI3K. The ability of these signatures to stratify samples according to functional activation of MEK and/or selumetinib sensitivity was shown in multiple independent melanoma, colon, breast, and lung tumor cell lines and in xenograft models. Furthermore, we were able to measure these signatures in fixed archival melanoma tumor samples using a single RT-qPCR-based test and found intergene correlations and associations with genetic markers of pathway activity to be preserved. These signatures offer useful tools for the study of MEK biology and clinical application of MEK inhibitors, and the novel approaches taken may benefit other targeted therapies.
Conflict of interest statement
Disclosure of Potential Conflicts of Interest
No potential conflicts of interest were disclosed.
Figures
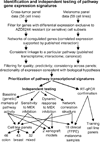
Figure 1
Preprocessing and gene expression analysis were done separately for each of the mixed-tumor and melanoma cell line panels. Transcriptional signature gene expression was tested against selumetinib (AZD6244) sensitivity and dynamic pathway activity in multiple independent data sets. Methods were partially automated using R (
) and workflow technology (Infor Sense KDE,
). RT-qPCR, reverse transcription quantitative PCR.
Figure 2
A consistent bimodal distribution of cell lines is seen relative to selumetinib GI50 in both the mixed-tumor (A) and melanoma (B) panels, suggesting distinct populations of responding (<1 µmol/L) and resistant (>10 µmol/L) cell lines. In the mixed-tumor panel, BRAF and, to a lesser extent, RAS mutations are concentrated in sensitive cell lines, whereas a trend is visible for mutational activation of the PI3K pathway (deletion/amplification/point mutation in PTEN, PI3K, or AKT) in resistant cell lines. Responding cell lines and differing genetic phenotypes are unevenly distributed across cells of differing tissues of origin (controlled for within statistical analyses).
Figure 3
Western blots of lung (A), colon (mixed-tumor panel; B), and melanoma (C) cell lines, ordered by response (GI50) to selumetinib, suggest a range of pERK and pAkt expression in both sensitive and resistant cells. In resistant cell lines, trends are visible for low pERK (suggesting inactivity of MEK), or high pERK alongside high pAkt (suggesting that dependency on MEK signaling is reduced through PI3K activity); however, these relationships are not absolute. Scaled mean expressions from mRNA signatures identified as predictive of selumetinib response are also shown, with little correlation obvious between pERK and MEK-functional-activation or between pAkt and compensatory-resistance.
Figure 4
A, genes prioritized in the MEK-functional-activation and compensatory-resistance network signatures are shown. The identification of genes displaying consistent expression in published pathway transcriptome signatures enhanced biological characterization otherwise achieved through protein interaction/canonical pathway based information. RAF/MEK/ERK biological overlay is seen exclusively in the MEK-functional-activation signature, whereas RAS signaling alongside that linked to broader MAPK activity (PTEN/PI3K, TGF/TNF/IL-6/NF-κB and DNA repair; refs. 7, 24, 38, 39) is concentrated to the compensatory-resistance signature genes. B, unsupervised clustering highlights correlations between genes within transcriptome network signatures and separates selumetinib (AZD6244) responsive from nonresponsive cell lines. C, taking the mean scaled expression for genes within signatures highlights the cell line subset–specific nature of expression, with MEK-functional-activation exclusively low in a resistant cell line subset and high compensatory-resistance limited to a subset of resistant cell lines. D, cell lines harboring BRAF and, to a lesser extent, RAS activating mutations display high expression of the MEK-functional-activation signature. No obvious correlation is visible between compensatory-resistance signature expression and RAS and/or PI3K pathway mutations.
Figure 5
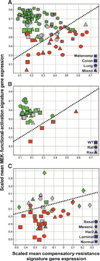
Selumetinib sensitive (green) cell lines show higher MEK-functional-activation and/or lower compensatory-resistance signature expression. The converse is true of resistant (red) cell lines, and cells of intermediate sensitivity (gray) lie in between. In no cases is high compensatory-resistance expression seen without expression of MEK-functional-activation, suggesting that the mechanisms represented by these signatures are not mutually exclusive. A, the threshold at which optimal separation of sensitive from resistant cell lines is achieved in the mixed-tumor/melanoma cell panels is illustrated with a dotted line. B, consistent separation at the same threshold is achieved in an independent panel of colon cell lines, where all BRAF-mutant tumors show high expression of the MEK-functional-activation signature. C, signatures also show a consistent trend relative to response in an independent breast cell panel, where higher MEK-functional-activation expression is predominantly seen in the basal/mesenchymal subtype known to show higher activity of MEK (6). As expression in this breast panel was measured using a different gene expression platform, threshold values are not directly comparable to those in A and B.
Figure 6
A, the MEK-functional-activation signature is significantly upregulated following transfection of activated MEK into the MCF7 cell line (28). B, furthermore, a knockdown of MEK-functional-activation signature expression is consistently seen following MEK inhibition with PD0325901 across cell lines (pairs joined with a solid line) independent of tissue of origin (triangle, melanoma; circle, other). Cells responsive to MEK inhibition (black to gray) show higher MEK-functional-activation expression in the DMSO-treated control and typically harbor mutations in BRAF or NRAS. RTK (EGFR/ERBB2)-driven cell lines show markedly lower starting MEK-functional-activation expression and are predominantly resistant to MEK inhibition (white). BRAFV600E PTEN-mutant cells show higher MEK-functional-activation expression but variable sensitivity to MEK inhibition. C, this genotype-specific pattern of MEK-functional-activation expression is reproducible in BRAF-activated (SKMEL28) and ERBB2-amplified (BT474) tumor xenograft models following MEK inhibitor treatment (24). D, although expression from the MEK-functional-activation signature seems to be high in most FFPE melanoma tissue samples, there is a trend for highest expression from patients harboring mutations in BRAF, with lower expression limited to BRAF WT.
Similar articles
- Basal and treatment-induced activation of AKT mediates resistance to cell death by AZD6244 (ARRY-142886) in Braf-mutant human cutaneous melanoma cells.
Gopal YN, Deng W, Woodman SE, Komurov K, Ram P, Smith PD, Davies MA. Gopal YN, et al. Cancer Res. 2010 Nov 1;70(21):8736-47. doi: 10.1158/0008-5472.CAN-10-0902. Epub 2010 Oct 19. Cancer Res. 2010. PMID: 20959481 Free PMC article. - Roles of the RAF/MEK/ERK and PI3K/PTEN/AKT pathways in malignant transformation and drug resistance.
McCubrey JA, Steelman LS, Abrams SL, Lee JT, Chang F, Bertrand FE, Navolanic PM, Terrian DM, Franklin RA, D'Assoro AB, Salisbury JL, Mazzarino MC, Stivala F, Libra M. McCubrey JA, et al. Adv Enzyme Regul. 2006;46:249-79. doi: 10.1016/j.advenzreg.2006.01.004. Epub 2006 Jul 18. Adv Enzyme Regul. 2006. PMID: 16854453 - Resistance to Selumetinib (AZD6244) in colorectal cancer cell lines is mediated by p70S6K and RPS6 activation.
Grasso S, Tristante E, Saceda M, Carbonell P, Mayor-López L, Carballo-Santana M, Carrasco-García E, Rocamora-Reverte L, García-Morales P, Carballo F, Ferragut JA, Martínez-Lacaci I. Grasso S, et al. Neoplasia. 2014 Oct 23;16(10):845-60. doi: 10.1016/j.neo.2014.08.011. eCollection 2014 Oct. Neoplasia. 2014. PMID: 25379021 Free PMC article. - Selumetinib (AZD6244; ARRY-142886) in the treatment of metastatic melanoma.
Patel SP, Kim KB. Patel SP, et al. Expert Opin Investig Drugs. 2012 Apr;21(4):531-9. doi: 10.1517/13543784.2012.665871. Epub 2012 Mar 7. Expert Opin Investig Drugs. 2012. PMID: 22394161 Review. - Targeting the Raf-MEK-ERK mitogen-activated protein kinase cascade for the treatment of cancer.
Roberts PJ, Der CJ. Roberts PJ, et al. Oncogene. 2007 May 14;26(22):3291-310. doi: 10.1038/sj.onc.1210422. Oncogene. 2007. PMID: 17496923 Review.
Cited by
- eIF4F controls ERK MAPK signaling in melanomas with BRAF and NRAS mutations.
Valcikova B, Vadovicova N, Smolkova K, Zacpalova M, Krejci P, Lee S, Rauch J, Kolch W, von Kriegsheim A, Dorotikova A, Andrysik Z, Vichova R, Vacek O, Soucek K, Uldrijan S. Valcikova B, et al. Proc Natl Acad Sci U S A. 2024 Oct 29;121(44):e2321305121. doi: 10.1073/pnas.2321305121. Epub 2024 Oct 22. Proc Natl Acad Sci U S A. 2024. PMID: 39436655 Free PMC article. - A pan-cancer screen identifies drug combination benefit in cancer cell lines at the individual and population level.
Vis DJ, Jaaks P, Aben N, Coker EA, Barthorpe S, Beck A, Hall C, Hall J, Lightfoot H, Lleshi E, Mironenko T, Richardson L, Tolley C, Garnett MJ, Wessels LFA. Vis DJ, et al. Cell Rep Med. 2024 Aug 20;5(8):101687. doi: 10.1016/j.xcrm.2024.101687. Cell Rep Med. 2024. PMID: 39168097 Free PMC article. - snRNA-seq of human cutaneous neurofibromas before and after selumetinib treatment implicates role of altered Schwann cell states, inter-cellular signaling, and extracellular matrix in treatment response.
Church C, Fay CX, Kriukov E, Liu H, Cannon A, Baldwin LA, Crossman DK, Korf B, Wallace MR, Gross AM, Widemann BC, Kesterson RA, Baranov P, Wallis D. Church C, et al. Acta Neuropathol Commun. 2024 Jun 21;12(1):102. doi: 10.1186/s40478-024-01821-z. Acta Neuropathol Commun. 2024. PMID: 38907342 Free PMC article. - Bile acid metabolites enhance expression of cathelicidin antimicrobial peptide in airway epithelium through activation of the TGR5-ERK1/2 pathway.
Myszor IT, Lapka K, Hermannsson K, Rekha RS, Bergman P, Gudmundsson GH. Myszor IT, et al. Sci Rep. 2024 Mar 21;14(1):6750. doi: 10.1038/s41598-024-57251-3. Sci Rep. 2024. PMID: 38514730 Free PMC article. - Response Rate and Molecular Correlates to Encorafenib and Binimetinib in BRAF-V600E Mutant High-Grade Glioma.
Schreck KC, Strowd RE, Nabors LB, Ellingson BM, Chang M, Tan SK, Abdullaev Z, Turakulov R, Aldape K, Danda N, Desideri S, Fisher J, Iacoboni M, Surakus T, Rudek MA, Bettegowda C, Grossman SA, Ye X. Schreck KC, et al. Clin Cancer Res. 2024 May 15;30(10):2048-2056. doi: 10.1158/1078-0432.CCR-23-3241. Clin Cancer Res. 2024. PMID: 38446982 Free PMC article. Clinical Trial.
References
- Davies BR, Logie A, McKay JS, et al. AZD6244 (ARRY-142886), a potent inhibitor of mitogen-activated protein kinase/extracellular signal-regulated kinase kinase 1/2 kinases: mechanism of action in vivo, pharmacokinetic/pharmacodynamic relationship, and potential for combination in preclinical models. Mol Cancer Ther. 2007;6:2209–2219. - PubMed
- Brose MS, Volpe P, Feldman M, et al. BRAF and RAS mutations in human lung cancer and melanoma. Cancer Res. 2002;62:6997–7000. - PubMed
- Sebolt-Leopold JS, Dudley DT, Herrera R, et al. Blockade of the MAP kinase pathway suppresses growth of colon tumors in vivo. Nat Med. 1999;5:810–816. - PubMed
MeSH terms
Substances
Grants and funding
- K08 CA127350/CA/NCI NIH HHS/United States
- K08 CA127350-01A2/CA/NCI NIH HHS/United States
- K08 CA127350-02/CA/NCI NIH HHS/United States
- K08 CA127350-03/CA/NCI NIH HHS/United States
LinkOut - more resources
Full Text Sources
Other Literature Sources
Research Materials


