Activity-dependent regulation of mitochondrial motility by calcium and Na/K-ATPase at nodes of Ranvier of myelinated nerves - PubMed (original) (raw)
Comparative Study
Activity-dependent regulation of mitochondrial motility by calcium and Na/K-ATPase at nodes of Ranvier of myelinated nerves
Chuan Li Zhang et al. J Neurosci. 2010.
Abstract
The node of Ranvier is a tiny segment of a myelinated fiber with various types of specializations adapted for generation of high-speed nerve impulses. It is ionically specialized with respect to ion channel segregation and ionic fluxes, and metabolically specialized in ionic pump expression and mitochondrial density augmentation. This report examines the interplay of three important parameters (calcium fluxes, Na pumps, mitochondrial motility) at nodes of Ranvier in frog during normal nerve activity. First, we used calcium dyes to resolve a highly localized elevation in axonal calcium at a node of Ranvier during action potentials, and showed that this calcium elevation retards mitochondrial motility during nerve impulses. Second, we found, surprisingly, that physiologic activation of the Na pumps retards mitochondrial motility. Blocking Na pumps alone greatly prevents action potentials from retarding mitochondrial motility, which reveals that mitochondrial motility is coupled to Na/K-ATPase. In conclusion, we suggest that during normal nerve activity, Ca elevation and activation of Na/K-ATPase act, possibly in a synergistic manner, to recruit mitochondria to a node of Ranvier to match metabolic needs.
Figures
Figure 1.
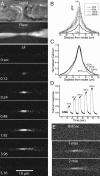
Action potentials trigger localized Ca rise at nodes of Ranvier in frog myelinated axons. A, Time-lapsed Ca fluorescent images showing nodal Ca response evoked by repetitive action potentials (4 s at 25 Hz). The top two images are light microscopic and fluorescent images, respectively, of a single node with adjacent paranodes. The fluorescent image shows that only the axon cylinder is labeled with the cell-impermeant calcium dye OGB-1. The rest of the images show fluorescent-subtracted images (Δ_F_) from the control (time, 0 s) at various times during and after stimulation. The stimulation was turned off at 4 s. The evoked Ca response centers at the node and spreads to no more than ±20 μm into the two paranodes. B, C, Spatial distribution of evoked Ca response. The node is positioned at 0. The frequency of stimulation was increased from 25 to 250 Hz at a fixed duration of 4 s. The amplitude of evoked Ca response increased with stimulation frequency (B), but the spatial spread into the paranodes (C; normalized with respect to the peak) remained unaffected (N = 5). D, Temporal response of nodal Ca signal evoked by increasing stimulation frequency. E, Nodal Ca responses remain localized even at prolonged stimulation. Fluorescent-subtracted images (from control) at 1 and 2 min of continuous stimulation at 200 Hz.
Figure 2.
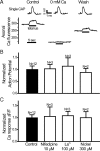
Effects of calcium-free solutions and Ca channel blockers on the evoked nodal Ca response. A, Top, Single CAPs in response to Ca-free solutions. Bottom, Axonal Ca fluorescence during a tetanus (25 Hz, 4 s) before and after Ca-free bath solutions. Note the difference in time scale between top and bottom. B, Normalized compound action potential amplitude in the presence of various Ca channel blockers. C, Corresponding evoked Ca responses in the presence of various Ca channel blockers. Error bars indicate SEM.
Figure 3.
Effects of FCCP and CGP on compound action potential and evoked nodal Ca response. A, FCCP (10 μ
m
, 15 min) blocks the evoked Ca response (bottom) but not the compound action potential (top). B, Averaged results for various blockers of the electron chain complex (antimycin, 20 μ
m
; FCCP, 10 μ
m
) and the mitochondrial ATPase (oligomycin, 10 μ
m
). Note that all compounds tested (15 min) did not affect the compound action potentials (top). C, CGP (50 μ
m
, 30 min) blocks the evoked nodal Ca response. The effect is reversible after extended wash (50 min). D, Averaged results for CGP at 10 μ
m
. CGP blocks evoked Ca response (right) without affecting the compound action potential (left). Error bars indicate SEM.
Figure 4.
Kymographs of mitochondrial motility. A, Still fluorescent image of MitoTracker-labeled mitochondria in the axon of a single myelinated fiber. The node is near the center where the axon shows a conspicuous constriction (supplemental Movie 1, available at
as supplemental material). B, C, Representative kymographs showing anterograde movement (positive slope), retrograde movement (negative slope), and pauses (between white arrowheads). The schematic drawing of myelinated axon applies to B and C. Note the position of the node and the flanking paranodes (PN) and juxtaparanode (JPN).
Figure 5.
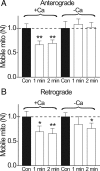
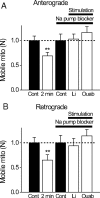
Activity-dependent reduction in number of mobile mitochondria is calcium-dependent. Relative changes in the number of mobile mitochondria (N) before and during repetitive stimulation (1 or 2 min; 200 Hz). A, Anterograde direction. B, Retrograde direction. In each experiment, the control consisted of counting N for 1 or 2 min before stimulation. Stimulation was immediately applied (200 Hz), and N was counted during stimulation in the same axon for the same time interval as in control (1 or 2 min). Each nerve was stimulated only once. The graph shows the relative change in N during stimulation compared to the control. In normal Ringer's solution, experiments were performed in 8 nodes for 1 min stimulations and 16 nodes in 2 min stimulations. In Ca-free conditions, the nerve was bathed in Ca-free solutions for 15 min before the experiment began. Notice that stimulation reduces anterograde N to 66% (1 min; N = 8 nodes) and 69% (2 min; N = 16 nodes), and retrograde N to 69% (1 min) and 65% (2 min). This activity-dependent reduction of N was completely abolished in Ca-free solutions for anterograde movement (A), which was slightly increased by 8% (1 min) and 2% (2 min) compared to prestimulation values. For the retrograde movement (B), there was a statistically significant reduction for 2 min stimulation (N reduced to 76%). *p < 0.05; **p < 0.01. Error bars indicate SEM.
Figure 6.
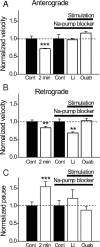
Activity-dependent changes in velocity and pause durations of mobile mitochondria are calcium dependent. The velocities and pause durations during stimulations were expressed relative to the control. Data are from the same set of nerves in Figure 5. A, Anterograde velocity. Normal Ca (+Ca), Velocity was reduced by 10% (from 0.51 ± 0.042 μm/s to 0.45 ± 0.026 μm/s; N = 8 nodes) during 1 min stimulation, and by 27% (from 0.73 ± 0.02 μm/s to 0.53 ± 0.01 μm/s; N = 16 nodes) during 2 min stimulation. Ca free (−Ca), Velocity was reduced by 9% (from 0.45 ± 0.03 μm/s to 0.49 ± 0.035 μm/s; N = 8 nodes) during 1 min stimulation, and by 3% (from 0.54 ± 0.02 μm/s to 0.52 ± 0.02 μm/s; N = 8 nodes) during 2 min stimulation. B, Retrograde velocity. Normal Ca, Velocity was reduced by 4% (from 0.46 ± 0.026 μm/s to 0.46 ± 0.02 μm/s) during 1 min stimulation, and by 18% (from 0.69 ± 0.027 μm/s to 0.57 ± 0.026 μm/s) during 2 min stimulation. Ca free, There was no change in velocity (from 0.46 ± 0.03 μm/s to 0.46 ± 0.026 μm/s) during 1 min stimulation, and velocity was reduced by 11% (from 0.54 ± 0.024 μm/s to 0.48 ± 0.02 μm/s) during 2 min stimulation. Numbers of the node are the same as in A. C, Pause duration. Normal Ca, Pause duration was reduced by 23% (from 16.6 ± 2.8 s to 12.8 ± 2.1 s) during 1 min stimulation and increased by 54% (from 12.3 ± 0.9 s to 18.9 ± 1.8 s) during 2 min stimulation. Only the increase in 2 min stimulation is statistically significant. Ca free, Pause duration increased by 24% (from 12.6 ± 2.3 s to 15.7 ± 2.6 s) during 1 min stimulation and was reduced by 2% (from 16.9 ± 2.4 s to 16.5 ± 1.4 s) during 2 min stimulation. Neither change is statistically significant. Numbers of nodes are the same as in A. *p < 0.05; **p < 0.01; ***p < 0.005. D, Histogram of anterograde velocity shows that the mitochondrial population with the most rapid velocity (asterisk) is preferentially reduced by 2 min stimulation (N = 8 nodes) in normal Ringer's solution. The histogram is plotted as a probability density function (normalized so that the area is 1) to facilitate comparison of the shapes of the two distributions. Error bars indicate SEM.
Figure 7.
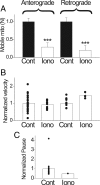
Effects of Ca ionophore on mitochondrial movement. Bath application of Ca ionophore ionomycin (10 μ
m
) was used to raise cytosolic Ca. Control, Zero Ca plus ionomycin for 15 min. Iono, Fifteen minutes after switching from control to high Ca (15 m
m
Ca plus ionomycin). A, Number of mobile mitochondria decreased by 71% and 80%, respectively, in anterograde and retrograde directions (N = 6 nodes) from 0 to high calcium. B, Velocity was reduced by 9% in anterograde (from 0.416 ± 0.03 μm/s to 0.38 ± 0.03 μm/s; p > 0.05) and increased by 47% in retrograde (from 0.44 ± 0.03 μm/s to 0.65 ± 0.05 μm/s; p > 0.05). C, Pause duration was reduced by 50% (from 14.78 ± 3.5 s to 7.36 ± 0.0 s; p < 0.01). Changes in B and C are not considered significant because of the small number of mobile mitochondria in high Ca (Iono). ***p < 0.005. Error bars indicate SEM.
Figure 8.
A, B, Activity-dependent reduction in number of mobile mitochondria is Na/K-ATPase dependent. Relative changes in the number of mobile mitochondria before [control (Cont)] and during repetitive stimulation (2 min; 200 Hz). Nerves were stimulated either in normal Ringer's solution or in two modified Ringer's solutions designed to block Na/K-ATPase but preserve action potentials [lithium replacing all bath Na (N = 6 nodes) or 0.5 m
m
ouabain (Ouab) in Ringer's solution (N = 6 nodes)]. Note that blocking Na/K-ATPase completely blocks activity-dependent reduction in the number of mobile mitochondria. **p < 0.01. Error bars indicate SEM.
Figure 9.
A–C, Activity-dependent changes in velocity and pause durations of mobile mitochondria is Na/K-ATPase dependent. Relative changes in these parameters before (Cont) and during stimulation (2 min; 200 Hz) in either normal or modified Ringer's solution [Li, N = 6; 0.5 m
m
ouabain (Ouab), N = 6] in which Na/K-ATPase was blocked but action potentials preserved. Note that blocking Na/K-ATPase in most cases blocked activity-dependent changes in velocity and pause durations, except in the case of retrograde movement in lithium. **p < 0.01; ***p < 0.005. Error bars indicate SEM.
Figure 10.
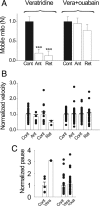
Artificial activation of Na/K-ATPase blocks mitochondrial movement. Nerves were incubated in a Ca-free solution for 15 min before switching to a Ca-free bath mixture designed to artificially active Na/K-ATPase [intracellular Na raised by 10 μ
m
veratridine (Vera); extracellular K raised from 3 to 20 m
m
]. Plots show results relative to the control in the Na/K-ATPase-activating mixture. A, Artificial activation of Na/K-ATPase dramatically reduced the number of mobile mitochondria by 81% in anterograde (Ant) and 88% in retrograde (Ret; N = 6 nodes). This reduction was mostly prevented by ouabain (oua; 0.5 m
m
) coapplication (N = 6 nodes). ***p < 0.005. B, C, Activation of Na/K-ATPase had no significant effect on the velocity and pause durations. Error bars indicate SEM.
Figure 11.
Manipulation of Na/K-ATPase does not cause secondary changes in intra-axonal Ca. A, B, Frequency dependence of evoked Ca axonal response in ouabain (A) and lithium (B). In each panel, the frequency dependence was first measured in the control (i.e., normal Ringer's solution), then measured again after 15 min of drug application in the same fiber. The evoked Ca responses were normalized relative to the peak response (200 Hz) in the control. The paradigm for measurement of evoked Ca response is similar to that in Figure 1_D_. The frequency dependence of evoked Ca response generated by brief pulses (4 s duration) is shown. C, Shape of evoked Ca response is similar in normal (N = 3), lithium (N = 2), and ouabain (N = 2) during prolonged stimulation (2 min duration). Representative traces are shown here. D, Effects of veratridine plus 20 m
m
K on intra-axonal Ca in normal Ringer's and in Ca-free bath solutions. E, Averaged results of the peak Ca response from D. ***p < 0.005. Error bars indicate SEM.
Similar articles
- Matching mitochondria to metabolic needs at nodes of Ranvier.
Chiu SY. Chiu SY. Neuroscientist. 2011 Aug;17(4):343-50. doi: 10.1177/1073858410393740. Epub 2011 Apr 25. Neuroscientist. 2011. PMID: 21518813 Review. - Effect of aconitine on the sodium permeability of the node of Ranvier.
Schmidt H, Schmitt O. Schmidt H, et al. Pflugers Arch. 1974 Jun 11;349(2):133-48. doi: 10.1007/BF00586624. Pflugers Arch. 1974. PMID: 4859290 No abstract available. - The mechanosensitive ion channel TRAAK is localized to the mammalian node of Ranvier.
Brohawn SG, Wang W, Handler A, Campbell EB, Schwarz JR, MacKinnon R. Brohawn SG, et al. Elife. 2019 Nov 1;8:e50403. doi: 10.7554/eLife.50403. Elife. 2019. PMID: 31674909 Free PMC article. - Involvement of both sodium influx and potassium efflux in ciguatoxin-induced nodal swelling of frog myelinated axons.
Mattei C, Molgó J, Benoit E. Mattei C, et al. Neuropharmacology. 2014 Oct;85:417-26. doi: 10.1016/j.neuropharm.2014.06.001. Epub 2014 Jun 17. Neuropharmacology. 2014. PMID: 24950451 - Molecular dissection of the myelinated axon.
Waxman SG, Ritchie JM. Waxman SG, et al. Ann Neurol. 1993 Feb;33(2):121-36. doi: 10.1002/ana.410330202. Ann Neurol. 1993. PMID: 7679565 Review.
Cited by
- Developmental regulation of microtubule-based trafficking and anchoring of axonal mitochondria in health and diseases.
Cheng XT, Sheng ZH. Cheng XT, et al. Dev Neurobiol. 2021 Apr;81(3):284-299. doi: 10.1002/dneu.22748. Epub 2020 May 2. Dev Neurobiol. 2021. PMID: 32302463 Free PMC article. Review. - Optical Read-out of Neural Activity in Mammalian Peripheral Axons: Calcium Signaling at Nodes of Ranvier.
Fontaine AK, Gibson EA, Caldwell JH, Weir RF. Fontaine AK, et al. Sci Rep. 2017 Jul 18;7(1):4744. doi: 10.1038/s41598-017-03541-y. Sci Rep. 2017. PMID: 28720792 Free PMC article. - Kv1.1 knock-in ataxic mice exhibit spontaneous myokymic activity exacerbated by fatigue, ischemia and low temperature.
Brunetti O, Imbrici P, Botti FM, Pettorossi VE, D'Adamo MC, Valentino M, Zammit C, Mora M, Gibertini S, Di Giovanni G, Muscat R, Pessia M. Brunetti O, et al. Neurobiol Dis. 2012 Sep;47(3):310-21. doi: 10.1016/j.nbd.2012.05.002. Epub 2012 May 17. Neurobiol Dis. 2012. PMID: 22609489 Free PMC article. - Data-driven modeling of mitochondrial dysfunction in Alzheimer's disease.
Toglia P, Demuro A, Mak DD, Ullah G. Toglia P, et al. Cell Calcium. 2018 Dec;76:23-35. doi: 10.1016/j.ceca.2018.09.003. Epub 2018 Sep 12. Cell Calcium. 2018. PMID: 30248575 Free PMC article. - Mitostasis in Neurons: Maintaining Mitochondria in an Extended Cellular Architecture.
Misgeld T, Schwarz TL. Misgeld T, et al. Neuron. 2017 Nov 1;96(3):651-666. doi: 10.1016/j.neuron.2017.09.055. Neuron. 2017. PMID: 29096078 Free PMC article. Review.
References
- Andrews H, White K, Thomson C, Edgar J, Bates D, Griffiths I, Turnbull D, Nichols P. Increased axonal mitochondrial activity as an adaptation to myelin deficiency in the Shiverer mouse. J Neurosci Res. 2006;83:1533–1539. - PubMed
- Andrews HE, Nichols PP, Bates D, Turnbull DM. Mitochondrial dysfunction plays a key role in progressive axonal loss in multiple sclerosis. Med Hypotheses. 2005;64:669–677. - PubMed
- Baloh RH. Mitochondrial dynamics and peripheral neuropathy. Neuroscientist. 2008;14:12–18. - PubMed
- Baron KT, Thayer SA. CGP37157 modulates mitochondrial Ca2+ homeostasis in cultured rat dorsal root ganglion neurons. Eur J Pharmacol. 1997;340:295–300. - PubMed
Publication types
MeSH terms
Substances
LinkOut - more resources
Full Text Sources
Other Literature Sources
